
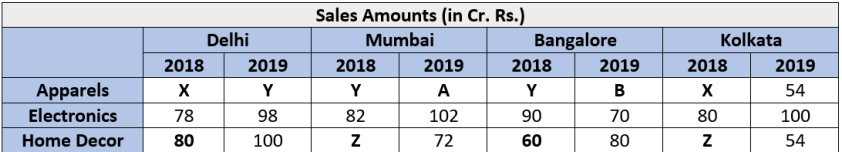
In HomeDecor departments of which cities were the sales amounts the highest in 2018 and 2019, respectively?
Started 1 year ago by Shashank in
Explanatory Answer
From (4),
Increase in Electronics sales from 2018 to 2019:
(98+102+70+100) – (78+82+90+80) = 4 0 = Increase in Apparels sales from 2018 to 2019
• From (5),
Total sales in Home Décor in 2019 = 100+72+80+54 = 306
Hence, Total sales in Home Décor in 2018 = 306 – 70 = 236
From (6), we know sales of Home Décor in 2018 of Delhi and Bangalore.
80 + Z + 60 + Z = 236
2Z = 96
Z = 48
• From (7), we know that
Y – X = B – Y
2Y = B + X
B = 2Y – X -----------( i )
Also,
A – Y = 54 – X ---------(ii)
• F rom (8), we know that Y , 54, and B are in A.P.
54 – Y = B – 54
B = 108 – Y ----------(iii)
Therefore, from ( i ) we get
108 – Y = 2Y – X
X = 3Y – 108 ------------(iv)
And (ii) becomes:
A – Y = 54 – (3Y – 108)
A = 54 – 3Y + 108 + Y
A = 162 – 2Y ----------(v)
• From (4), we knew that
( Y +A+B+54) – (X+ Y+Y +X) = 4 0
Substituting values from (iii), (iv), and (v), we get:
(Y+162-2Y+108-Y+54) – (3Y-108 +Y+Y+3Y-108) = 40
324 – 2Y – 8Y + 216 = 40
10Y = 500
Y = 50
Therefore, we get values of A, B, and X by substituting values of Y.
A = 162 – 2Y = 162 – 100
A = 62
B = 108 – y = 108 – 50
B = 58
X = 3Y – 108 = 150 – 108
X = 42
Therefore, our final table looks like this:
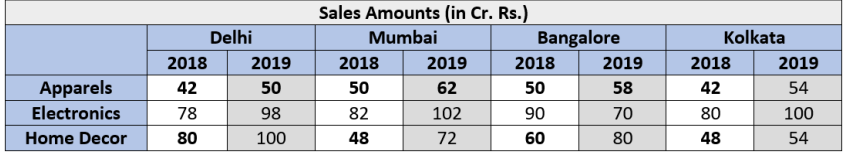
We can see form the table that Delhi had the highest sales amount in Home Décor in both the
years.
-
No one is replied to this question yet. Be first to reply!
Previous year papers
2023

2022
2021
2020
2019
2018