
Started 3 weeks ago by maitry choudhary in
7 Replies
-
@prantik-iim-l-alumni8317
Replied 1 year ago
554_LR_Queue_arranagement.mp4 209.72 MB
@vaibhav-pandey-cat-99086222
Replied 1 year ago
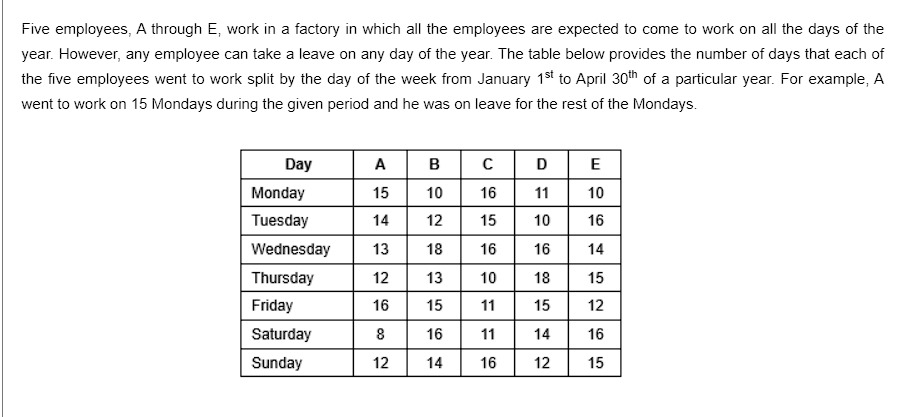
Hi Gourvit, hope this helps.Understanding the problem:The data: The table shows the number of days each employee worked on each weekday within a specific time period (Jan 1st to April 30th).The goal: The question likely asks you to analyze this data to draw conclusions about the employees' work patterns, leaves, or potentially compare them.Hints to solve the problem:Calculate Total Workdays:Figure out how many total days are there between January 1st and April 30th.Then calculate how many Mondays, Tuesdays, etc., fall within this period.Calculate Leave Days for Each Employee:For each employee and each weekday, subtract the number of days worked from the total number of that weekday in the given period. This will give you the number of leave days for that weekday.Add up the leave days across all weekdays to get the total leave days for each employee.Analyze and Compare:Once you have the leave days for each employee, you can compare them to see who took the most/least leave overall.You can also analyze the data to see if there are any patterns in when people tend to take leave (e.g., more leave on Fridays or Mondays?).Look for Specific Questions: The actual question might ask something more specific, like:Who took the most leave overall?On which day of the week did employees take the most leave on average?Did any employee take leave on all days of a particular weekday?Additional Tips:Organize your work: Make a separate table or list to track the leave days for each employee.Pay attention to details: The question mentions that employees are expected to work all days but can take leave. This implies that any difference between the total number of a weekday and the days worked is a leave day.Don't overthink: The question is likely testing your ability to understand and analyze data presented in a table. Focus on the calculations and comparisons, and you should be able to answer it!
@vaibhav-pandey-cat-99086222
Replied 1 year ago
Your browser does not support the audio element.
@maitrych512
Replied 3 weeks ago
not able to understand this question image.png 258.22 KB
@maitrych512
Replied 3 weeks ago
not able to understand this question image.png 258.22 KB
@gourvitar25
Replied 3 weeks ago
Not able to understand this question WhatsApp Image 2024-08-18 at 18.48.50_7ca40994.jpg 79.11 KB
@gourvitar25
Replied 3 weeks ago
Not able to understand this question WhatsApp Image 2024-08-18 at 18.48.50_7ca40994.jpg 79.11 KB