
Started 3 weeks ago by Prajakta Marshetwar in
8 Replies
-
@monika-cat-999-percentile2863
Replied 1 year ago
Hi there!We're happy to let you know that your question will be addressed in today's live doubt class, taking place on May 14th at 6:00 PMLive Class Link: https://catking.testpress.in/courses/439/contents/141582/In case you miss the class -You can still access the recording using the same link provided above. This will be the 8th question that Monika Ma'am will be solving in class.Happy Learning!
@monika-cat-999-percentile2863
Replied 1 year ago
Your browser does not support the audio element.
@nishantra783
Replied 1 year ago
got it, thank you
@nishantra783
Replied 1 year ago
got it, thank you
@prajaktama288
Replied 3 weeks ago
venn diagram Screenshot (30).png 45.98 KB
@prajaktama288
Replied 3 weeks ago
venn diagram Screenshot (30).png 45.98 KB
@nishantra783
Replied 3 weeks ago
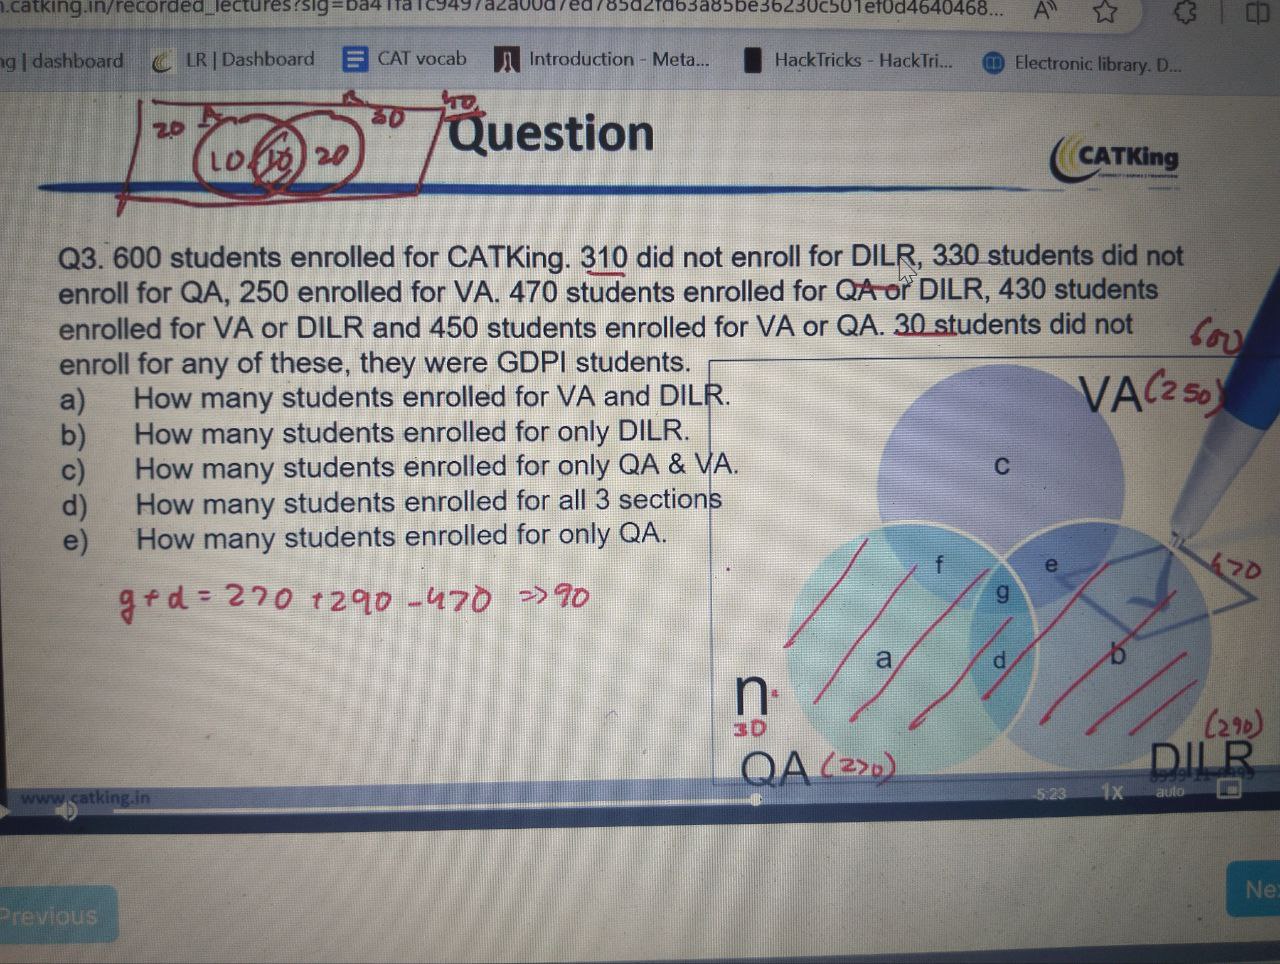
Venn diagram it is given that 30 are for GDPI, 310 did not select for DILR, so the total number of student who enrolled for DILR should be 600-30-310 = 260.and same for QA 600-30-330= 240 enrolled for QA??venn 3.jpg 265.29 KB
@nishantra783
Replied 3 weeks ago
Venn diagram it is given that 30 are for GDPI, 310 did not select for DILR, so the total number of student who enrolled for DILR should be 600-30-310 = 260.and same for QA 600-30-330= 240 enrolled for QA??venn 3.jpg 265.29 KB