
Live Updates
• CATKing has launched new chat bot.

• New video on Logs has been released.
13.2K
Learners
asked the doubt

Previous Year Questions
Eight gymnastics players numbered 1 through 8 underwent a training camp where they were coached by three
coaches - Xena, Yuki, and Zara. Each coach trained at least two players. Yuki trained only even numbered
players, while Zara trained only odd numbered players. After the camp, the coaches evaluated the players and
gave integer ratings to the respective players trained by them on a scale of 1 to 7, with 1 being the lowest rating
and 7 the highest.
The following additional information is known.
1. Xena trained more players than Yuki.
2. Player-1 and Player-4 were trained by the same coach, while the coaches who trained Player-2, Player-3 and
Player-5 were all different.
3. Player-5 and Player-7 were trained by the same coach and got the same rating. All other players got a unique
rating.
4. The average of the ratings of all the players was 4.
5. Player-2 got the highest rating.
6. The average of the ratings of the players trained by Yuki was twice that of the players trained by Xena and
two more than that of the players trained by Zara.
7. Player-4's rating was double of Player-8's and less than Player-5's.
What best can be concluded about the number of players coached by Zara?
Video Explanation

What was the rating of Player-7?
Video Explanation
What was the rating of Player-6?
Video Explanation
For how many players the ratings can be determined with certainty?
Video Explanation
The two plots below give the following information about six firms A, B, C, D, E, and F for 2019 and 2023.
PAT: The firm's profits after taxes in Rs. crores,
ES: The firm's employee strength, that is the number of employees in the firm, and
PRD: The percentage of the firm's PAT that they spend on Research and Development (R&D).
In the plots, the horizontal and vertical coordinates of point representing each firm gives their ES and PAT values respectively. The PRD values of each firm are proportional to the areas around the points representing each firm. The areas are comparable between the two plots, i.e., equal areas in the two plots represent the same PRD values for the two years.
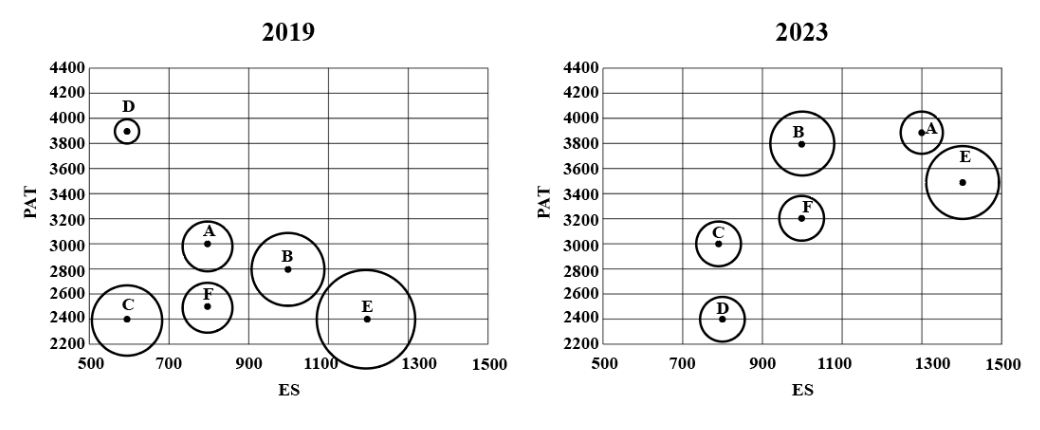
Assume that the annual rate of growth in PAT over the previous year (ARG) remained constant over the
years for each of the six firms. Which among the firms A, B, C, and E had the highest ARG?
Video Explanation
The ratio of the amount of money spent by Firm C on R&D in 2019 to that in 2023 is closest to
Video Explanation
Which among the firms A, C, E, and F had the maximum PAT per employee in 2023?
Video Explanation
Which among the firms C, D, E, and F had the least amount of R&D spending per employee in 2023?
Video Explanation
An online e-commerce firm receives daily integer product ratings from 1 through 5 given by buyers. The daily
average is the average of the ratings given on that day. The cumulative average is the average of all ratings
given on or before that day. The rating system began on Day 1, and the cumulative averages were 3 and 3.1 at
the end of Day 1 and Day 2, respectively. The distribution of ratings on Day 2 is given in the figure below.

The following information is known about ratings on Day 3.
1. 100 buyers gave product ratings on Day 3.
2. The modes of the product ratings were 4 and 5.
3. The numbers of buyers giving each product rating are non-zero multiples of 10.
4. The same number of buyers gave product ratings of 1 and 2, and that number is half the number of buyers
who gave a rating of 3.
How many buyers gave ratings on Day 1?
Video Explanation
What is the median of all ratings given on Day 3?
Video Explanation
Which of the following is true about the cumulative average ratings of Day 2 and Day 3?
Video Explanation
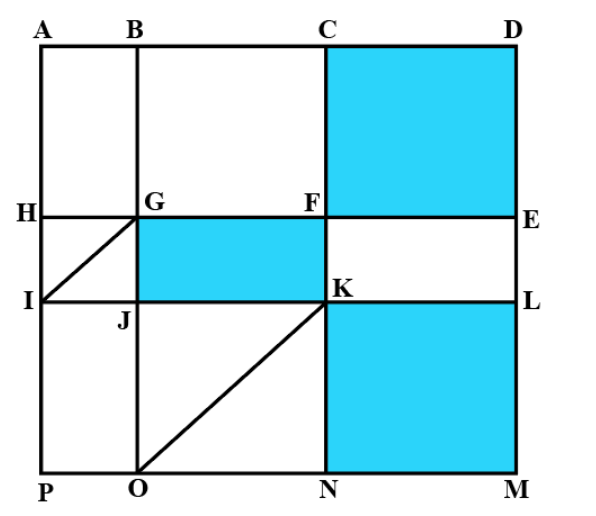
The above is a schematic diagram of walkways (indicated by all the straight-lines) and lakes (3 of them, each in
the shape of rectangles - shaded in the diagram) of a gated area. Different points on the walkway are indicated
by letters (A through P) with distances being OP = 150 m, ON = MN = 300 m, ML = 400 m, EL = 200 m, DE = 400m.
The following additional information about the facilities in the area is known.
1. The only entry/exit point is at C.
2. There are many residences within the gated area; all of them are located on the path AH and ML with four of
them being at A, H, M, and L.
3. The post office is located at P and the bank is located at B
One resident whose house is located at L, needs to visit the post office as well as the bank. What is the
minimum distance (in m) he has to walk starting from his residence and returning to his residence after
visiting both the post office and the bank?
Video Explanation
One person enters the gated area and decides to walk as much as possible before leaving the area without
walking along any path more than once and always walking next to one of the lakes. Note that he may
cross a point multiple times. How much distance (in m) will he walk within the gated area?
Video Explanation
The numbers 1, 2, 3, 4, 5, 6, 7, 8, 9, and 10 are placed in ten slots of the following grid based on the conditions
below.

1. Numbers in any row appear in an increasing order from left to right.
2. Numbers in any column appear in a decreasing order from top to bottom.
3. 1 is placed either in the same row or in the same column as 10.
4. Neither 2 nor 3 is placed in the same row or in the same column as 10.
5. Neither 7 nor 8 is placed in the same row or in the same column as 9.
6. 4 and 6 are placed in the same row.
What is the row number which has the least sum of numbers placed in that row?
Video Explanation
Which of the following statements MUST be true?
I. 10 is placed in a slot in Row 1.
II. 1 is placed in a slot in Row 4.
Video Explanation
Which of the following statements MUST be true?
I. 2 is placed in a slot in Column 2.
II. 3 is placed in a slot in Column 3.
Video Explanation
For how many slots in the grid, placement of numbers CANNOT be determined with certainty?
Video Explanation
What is the sum of the numbers placed in Column 4?
Video Explanation
The passage below is accompanied by four questions. Based on the passage, choose the best answer for
each question.
(. . .) There are three other common drivers for carnivore-human attacks, some of which are more preventable
than others. Natural aggression-based conflicts - such as those involving females protecting their young or
animals protecting a food source - can often be avoided as long as people stay away from those animals and
their food.
Carnivores that recognise humans as a means to get food, are a different story. As they become more reliant on
human food they might find at campsites or in rubbish bins, they become less avoidant of humans. Losing that
instinctive fear response puts them into more situations where they could get into an altercation with a human,
which often results in that bear being put down by humans. “A fed bear is a dead bear,” says Servheen, referring
to a common saying among biologists and conservationists. Predatory or predation-related attacks are quite
rare, only accounting for 17% of attacks in North America since 1955. They occur when a carnivore views a
human as prey and hunts it like it would any other animal it uses for food. (. . .)
Then there are animal attacks provoked by people taking pictures with them or feeding them in natural settings
such as national parks which often end with animals being euthanised out of precaution. “Eventually, that
animal becomes habituated to people, and [then] bad things happen to the animal. And the folks who initially
wanted to make that connection don’t necessarily realise that,” says Christine Wilkinson, a postdoctoral
researcher at UC Berkeley, California, who’s been studying coyote-human conflicts.
After conducting countless postmortems on all types of carnivore-human attacks spanning 75 years,
Penteriani’s team believes 50% could have been avoided if humans reacted differently. A 2017 study coauthored by Penteriani found that engaging in risky behaviour around large carnivores increases the likelihood
of an attack.
Two of the most common risky behaviours are parents leaving their children to play outside unattended and
walking an unleashed dog, according to the study. Wilkinson says 66% of coyote attacks involve a dog.
“[People] end up in a situation where their dog is being chased, or their dog chases a coyote, or maybe they’re
walking their dog near a den that’s marked, and the coyote wants to escort them away,” says Wilkinson.
Experts believe climate change also plays a part in the escalation of human-carnivore conflicts, but the
correlation still needs to be ironed out. “As finite resources become scarcer, carnivores and people are coming
into more frequent contact, which means that more conflict could occur,” says Jen Miller, international
programme specialist for the US Fish & Wildlife Service. For example, she says, there was an uptick in lion
attacks in western India during a drought when lions and people were relying on the same water sources.
(. . .) The likelihood of human-carnivore conflicts appears to be higher in areas of low-income countries
dominated by vast rural landscapes and farmland, according to Penteriani’s research. “There are a lot of
working landscapes in the Global South that are really heterogeneous, that are interspersed with carnivore
habitats, forests and savannahs, which creates a lot more opportunity for these encounters, just statistically,”
says Wilkinson.
According to the passage, what is a significant factor that contributes to the habituation of carnivores to
human presence?
Video Explanation
Which of the following statements, if false, would be inconsistent with the concerns raised in the passage
regarding the drivers of carnivore-human conflicts?
Video Explanation
According to the passage, which of the following scenarios would MOST likely exacerbate the frequency of
carnivore-human conflicts?
Video Explanation
The passage below is accompanied by four questions. Based on the passage, choose the best answer for
[S]pices were a global commodity centuries before European voyages. There was a complex chain of relations,
yet consumers had little knowledge of producers and vice versa. Desire for spices helped fuel European
colonial empires to create political, military and commercial networks under a single power.
Historians know a fair amount about the supply of spices in Europe during the medieval period - the origins,
methods of transportation, the prices - but less about demand. Why go to such extraordinary efforts to procure
expensive products from exotic lands? Still, demand was great enough to inspire the voyages of Christopher
Columbus and Vasco Da Gama, launching the first fateful wave of European colonialism. . . .
So, why were spices so highly prized in Europe in the centuries from about 1000 to 1500? One widely
disseminated explanation for medieval demand for spices was that they covered the taste of spoiled meat. . . .
Medieval purchasers consumed meat much fresher than what the average city-dweller in the developed world
of today has at hand. However, refrigeration was not available, and some hot spices have been shown to serve
as an anti-bacterial agent. Salting, smoking or drying meat were other means of preservation. Most spices used
in cooking began as medical ingredients, and throughout the Middle Ages spices were used as both medicines
and condiments. Above all, medieval recipes involve the combination of medical and culinary lore in order to
balance food's humeral properties and prevent disease. Most spices were hot and dry and so appropriate in
sauces to counteract the moist and wet properties supposedly possessed by most meat and fish. . . .
Where spices came from was known in a vague sense centuries before the voyages of Columbus. Just how
vague may be judged by looking at medieval world maps . . . To the medieval European imagination, the East
was exotic and alluring. Medieval maps often placed India close to the so-called Earthly Paradise, the Garden of
Eden described in the Bible.
Geographical knowledge has a lot to do with the perceptions of spices’ relative scarcity and the reasons for
their high prices. An example of the varying notions of scarcity is the conflicting information about how pepper
is harvested. As far back as the 7th century Europeans thought that pepper in India grew on trees "guarded" by
serpents that would bite and poison anyone who attempted to gather the fruit. The only way to harvest pepper
was to burn the trees, which would drive the snakes underground. Of course, this bit of lore would explain the
shriveled black peppercorns, but not white, pink or other colors.
Spices never had the enduring allure or power of gold and silver or the commercial potential of new products
such as tobacco, indigo or sugar. But the taste for spices did continue for a while beyond the Middle Ages. As
late as the 17th century, the English and the Dutch were struggling for control of the Spice Islands: Dutch New
Amsterdam, or New York, was exchanged by the British for one of the Moluccan Islands where nutmeg was
grown
It can be inferred that all of the following contributed to a decline in the allure of spices, EXCEPT:
Video Explanation
In the context of the passage, the people who heard the story of pepper trees being guarded by snakes
would be least likely to arrive at the conclusion that
Video Explanation
In the context of the passage, which one of the following conclusions CANNOT be reached?
Video Explanation
If a trader brought white peppercorns from India to medieval Europe, all of the following are unlikely to
happen, EXCEPT:
Video Explanation
The passage below is accompanied by four questions. Based on the passage, choose the best answer for
each question.
The job of a peer reviewer is thankless. Collectively, academics spend around 70 million hours every year
evaluating each other’s manuscripts on the behalf of scholarly journals — and they usually receive no monetary
compensation and little if any recognition for their effort. Some do it as a way to keep abreast with
developments in their field; some simply see it as a duty to the discipline. Either way, academic publishing
would likely crumble without them.
In recent years, some scientists have begun posting their reviews online, mainly to claim credit for their work.
Sites like Publons allow researchers to either share entire referee reports or simply list the journals for whom
they’ve carried out a review…. The rise of Publons suggests that academics are increasingly placing value on
the work of peer review and asking others, such as grant funders, to do the same. While that’s vital in the
publish-or-perish culture of academia, there’s also immense value in the data underlying peer review. Sharing
peer review data could help journals stamp out fraud, inefficiency, and systemic bias in academic publishing.….
Peer review data could also help root out bias. Last year, a study based on peer review data for nearly 24,000
submissions to the biomedical journal eLife found that women and non- Westerners were vastly
underrepresented among peer reviewers. Only around one in every five reviewers was female, and less than two
percent of reviewers were based in developing countries…. Openly publishing peer review data could perhaps
also help journals address another problem in academic publishing: fraudulent peer reviews. For instance, a
minority of authors have been known to use phony email addresses to pose as an outside expert and review
their own manuscripts.…
Opponents of open peer review commonly argue that confidentiality is vital to the integrity of the review
process; referees may be less critical of manuscripts if their reports are published, especially if they are
revealing their identities by signing them. Some also hold concerns that open reviewing may deter referees
from agreeing to judge manuscripts in the first place, or that they’ll take longer to do so out of fear of scrutiny….
Even when the content of reviews and the identity of reviewers can’t be shared publicly, perhaps journals could
share the data with outside researchers for study. Or they could release other figures that wouldn’t compromise
the anonymity of reviews but that might answer important questions about how long the reviewing process
takes, how many researchers editors have to reach out to on average to find one who will carry out the work,
and the geographic distribution of peer reviewers.
Of course, opening up data underlying the reviewing process will not fix peer review entirely, and there may be
instances in which there are valid reasons to keep the content of peer reviews hidden and the identity of the
referees confidential. But the norm should shift from opacity in all cases to opacity only when necessary.
According to the passage, which of the following is the only reason NOT given in favour of making peer
review data public?
Video Explanation
All of the following are listed as reasons why academics choose to review other scholars’ work EXCEPT:
Video Explanation
Based on the passage we can infer that the author would most probably support
Video Explanation
According to the passage, some are opposed to making peer reviews public for all the following reasons
EXCEPT that it
Video Explanation
Previous year papers
2024

2023
2022
2021
2020
2019
2018