
Live Updates
• CATKing has launched new chat bot.

• New video on Logs has been released.
13.2K
Learners
asked the doubt

Previous Year Questions
What best can be concluded about the number of times the AC must have either been turned on or the AC
temperature setting been altered between 11:01 pm and 1:59 am?
Video Explanation

What was the temperature outside, in degree Celsius, at 9 pm?
Video Explanation
What was the temperature outside, in degree Celsius, at 1 am?
Video Explanation
How many times the AC must have been turned off between 11:01 pm and 1:59 am?
Video Explanation
The air-conditioner (AC) in a large room can be operated either in REGULAR mode or in POWER mode to reduce
the temperature.
If the AC operates in REGULAR mode, then it brings down the temperature inside the room(called inside
temperature) at a constant rate to the set temperature in 1 hour. If it operates in POWER mode, then this is
achieved in 30 minutes.
If the AC is switched off, then the inside temperature rises at a constant rate so as to reach the temperature
outside at the time of switching off in 1 hour.
The temperature outside has been falling at a constant rate from 7 pm onward until 3 am on a particular night.
The following graph shows the inside temperature between 11 pm (23:00)and 2 am (2:00) that night.
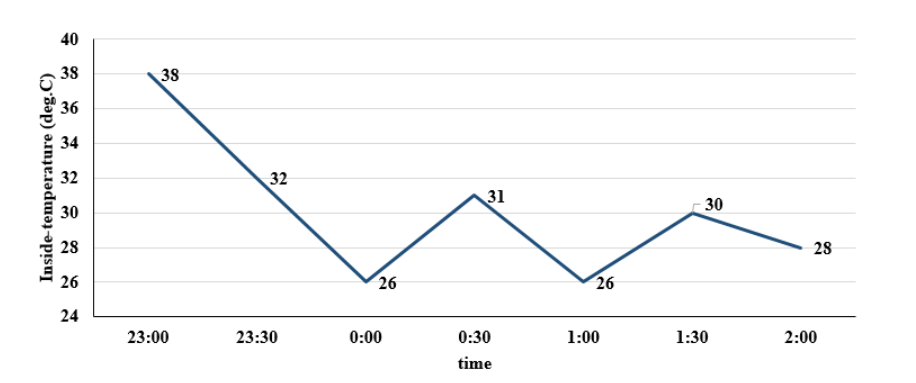
The following facts are known about the AC operation that night.
• The AC was turned on for the first time that night at 11 pm (23:00).
• The AC setting was changed (including turning it on/off, and/or setting different temperatures) only at the
beginning of the hour or at 30 minutes after the hour.
• The AC was used in POWER mode for longer duration than in REGULAR mode during this 3-hour period.
How many times the AC must have been turned off between 11:01 pm and 1:59 am?
Video Explanation
What was the temperature outside, in degree Celsius, at 1 am?
Video Explanation
What was the temperature outside, in degree Celsius, at 9 pm?
Video Explanation
What best can be concluded about the number of times the AC must have either been turned on or the AC
temperature setting been altered between 11:01 pm and 1:59 am?
Video Explanation
For how many countries among Country 1 through Country 8 will the GDP per capita in 2027 be lower than
that in 2024?
Video Explanation
Which one among the countries 1, 4, 5, and 7 will have the largest population in 2027?
Video Explanation
The ratio of Country 4’s GDP to Country 5’s GDP in 2026 will be closest to
Video Explanation
Which one among the countries 1 through 8, has the smallest population in 2024?
Video Explanation
Out of 10 countries -- Country 1 through Country 10 -- Country 9 has the highest gross domestic product (GDP),
and Country 10 has the highest GDP per capita. GDP per capita is the GDP of a country divided by its
population. The table below provides the following data about Country 1 through Country 8 for the year 2024.
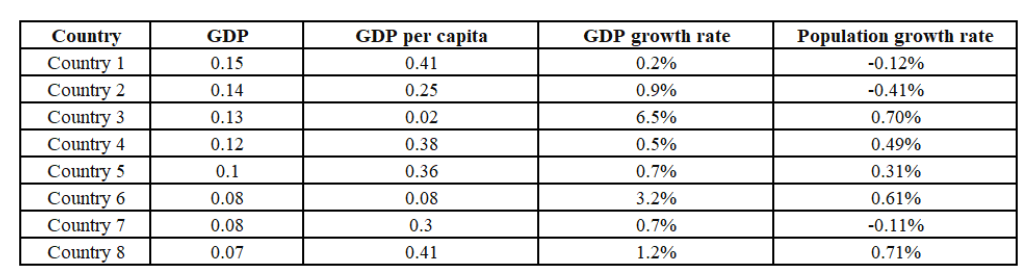
• Column 1 gives the country's identity.
• Column 2 gives the country’s GDP as a fraction of the GDP of Country 9.
• Column 3 gives the country’s GDP per capita as a fraction of the GDP per capita of Country10.
• Column 4 gives the country’s annual GDP growth rate.
• Column 5 gives the country’s annual population growth rate.
Assume that the GDP growth rates and population growth rates of the countries will remain constant for the
next three years
Which one among the countries 1 through 8, has the smallest population in 2024?
Video Explanation
The ratio of Country 4’s GDP to Country 5’s GDP in 2026 will be closest to
Video Explanation
Which one among the countries 1, 4, 5, and 7 will have the largest population in 2027?
Video Explanation
For how many countries among Country 1 through Country 8 will the GDP per capita in 2027 be lower than
that in 2024?
Video Explanation
What could be the minimum percentage of subscribers who used multiple apps in 2024?
Video Explanation
What was the percentage increase in the number of subscribers in the ‘Elder’ categoryfrom 2023 to 2024?
Video Explanation
What percentage of subscribers in the ‘Kid’ category used multiple apps in 2023?
Video Explanation
How many subscribers belonged to the ‘Others’ category in 2024?
Video Explanation
Comprehension:
Over the top (OTT) subscribers of a platform are segregated into three categories: i) Kid, ii)Elder, and iii) Others.
Some of the subscribers used one app and the others used multiple apps to access the platform. The figure
below shows the percentage of the total number of subscribers in 2023 and 2024 who belong to the ‘Kid’ and
‘Elder’ categories.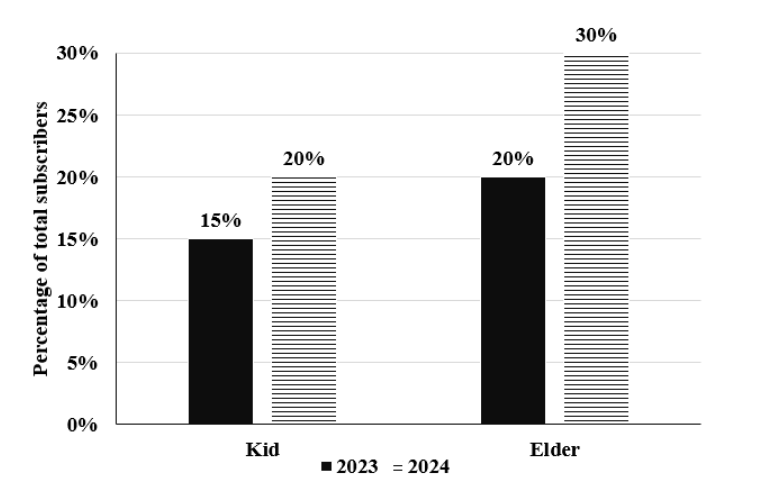
The following additional facts are known about the numbers of subscribers.
1. The total number of subscribers increased by 10% from 2023 to 2024.
2. In 2024, 1/2 of the subscribers from the ‘Kid’ category and 2/3 of the subscribers from the ‘Elder’ category
subscribers use one app.
3. In 2023, the number of subscribers from the ‘Kid’ category who used multiple apps was the same as the
number of subscribers from the ‘Elder’ category who used one app.
4. 10,000 subscribers from the ‘Kid’ category used one app and 15,000 subscribers from the ‘Elder’ category
used multiple apps in 2023.
How many subscribers belonged to the ‘Others’ category in 2024?
Video Explanation
What percentage of subscribers in the ‘Kid’ category used multiple apps in 2023?
Video Explanation
What was the percentage increase in the number of subscribers in the ‘Elder’ categoryfrom 2023 to 2024?
Video Explanation
What could be the minimum percentage of subscribers who used multiple apps in 2024?
Video Explanation
What is the median of the number of grams of protein in 100 grams of nutrients among these food grains?
Video Explanation
How many grams of other nutrients were there in 100 grams of nutrients in M3?
Video Explanation
How many grams of protein were there in 100 grams of nutrients in M2?
Video Explanation
How many foodgrains had a higher amount of carbohydrate per 100 grams ofnutrients than M1?
Video Explanation
The table given below shows the amount, in grams, of carbohydrate, protein, fat and all other nutrients, per 100
grams of nutrients in seven food grains. The first column shows the food grain category and the second
column its codename. The table has some missing values.
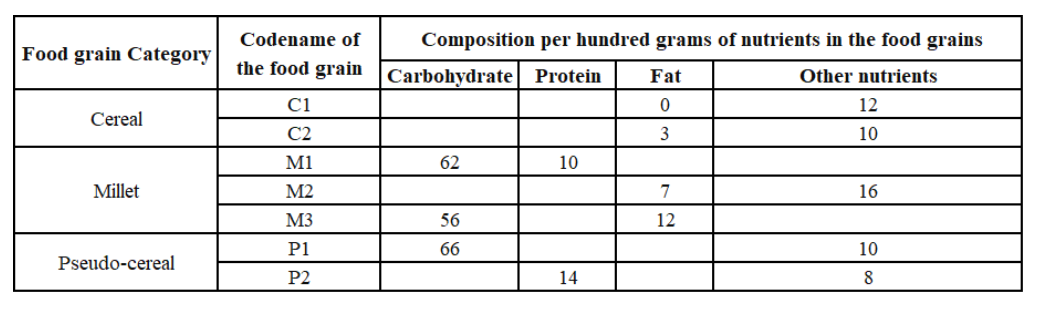
The following additional facts are known.
1. Both the pseudo-cereals had higher amounts of carbohydrate as well as higher amounts of protein than any
millet.
2. Both the cereals had higher amounts of carbohydrate than any pseudo-cereal.
3. All the missing values of carbohydrate amounts (in grams) for all the food grains are non-zero multiples of 5.
4. All the missing values of protein, fat and other nutrients amounts (in grams) for all the food grains are nonzero multiples of 4.
5. P1 contained double the amount of protein that M3 contains.
How many foodgrains had a higher amount of carbohydrate per 100 grams ofnutrients than M1?
Video Explanation
How many grams of protein were there in 100 grams of nutrients in M2?
Video Explanation
How many grams of other nutrients were there in 100 grams of nutrients in M3?
Video Explanation
What is the median of the number of grams of protein in 100 grams of nutrients among these food grains?
Video Explanation
What is the number of ATMs whose locations and cash requirements can both be uniquely determined?
Video Explanation
What best can be said about the road distance (in km) between the ATMs having the second highest and
the second lowest cash requirements?
Video Explanation
Which of the following two statements is/are DEFINITELY true?
Statement A: Each of R-A, R-B, and R-C has two ATMs.
Statement B: Each of V1, V2, and V3 has two ATMs.
Video Explanation
How many ATMs have cash requirements of Rs. 10 Lakhs or more?
Video Explanation
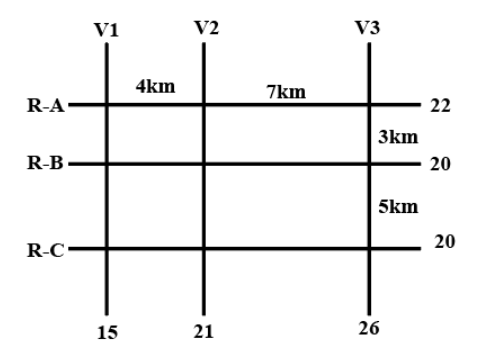
The figure below shows a network with three parallel roads represented by horizontal lines R-A, R-B, and R-C
and another three parallel roads represented by vertical lines V1, V2, and V3. The figure also shows the distance
(in km) between two adjacent intersections.Six ATMs are placed at six of the nine road intersections. Each ATM
has a distinct integer cash requirement (in Rs. Lakhs), and the numbers at the end of each line in the figure
indicate the total cash requirements of all ATMs placed on the corresponding road. For example, the total cash
requirement of the ATM(s) placed on road R-A is Rs. 22 Lakhs.
The following additional information is known.
1. The ATMs with the minimum and maximum cash requirements of Rs. 7 Lakhs and Rs. 15 Lakhs are placed
on the same road.
2. The road distance between the ATM with the second highest cash requirement and the ATM located at the
intersection of R-C and V3 is 12 km.
How many ATMs have cash requirements of Rs. 10 Lakhs or more?
Video Explanation
Which of the following two statements is/are DEFINITELY true?
Statement A: Each of R-A, R-B, and R-C has two ATMs.
Statement B: Each of V1, V2, and V3 has two ATMs.
Video Explanation
What best can be said about the road distance (in km) between the ATMs having the second highest and
the second lowest cash requirements?
Video Explanation
What is the number of ATMs whose locations and cash requirements can both be uniquely determined?
Video Explanation
For how many players the ratings can be determined with certainty?
Video Explanation
What was the rating of Player-6?
Video Explanation
What was the rating of Player-7?
Video Explanation
What best can be concluded about the number of players coached by Zara?
Video Explanation
Eight gymnastics players numbered 1 through 8 underwent a training camp where they were coached by three
coaches - Xena, Yuki, and Zara. Each coach trained at least two players. Yuki trained only even numbered
players, while Zara trained only odd numbered players. After the camp, the coaches evaluated the players and
gave integer ratings to the respective players trained by them on a scale of 1 to 7, with 1 being the lowest rating
and 7 the highest.
The following additional information is known.
1. Xena trained more players than Yuki.
2. Player-1 and Player-4 were trained by the same coach, while the coaches who trained Player-2, Player-3 and
Player-5 were all different.
3. Player-5 and Player-7 were trained by the same coach and got the same rating. All other players got a unique
rating.
4. The average of the ratings of all the players was 4.
5. Player-2 got the highest rating.
6. The average of the ratings of the players trained by Yuki was twice that of the players trained by Xena and
two more than that of the players trained by Zara.
7. Player-4's rating was double of Player-8's and less than Player-5's.
What best can be concluded about the number of players coached by Zara?
Video Explanation
What was the rating of Player-7?
Video Explanation
What was the rating of Player-6?
Video Explanation
For how many players the ratings can be determined with certainty?
Video Explanation
Which among the firms C, D, E, and F had the least amount of R&D spending per employee in 2023?
Video Explanation
Which among the firms A, C, E, and F had the maximum PAT per employee in 2023?
Video Explanation
The ratio of the amount of money spent by Firm C on R&D in 2019 to that in 2023 is closest to
Video Explanation
Assume that the annual rate of growth in PAT over the previous year (ARG) remained constant over the
years for each of the six firms. Which among the firms A, B, C, and E had the highest ARG?
Video Explanation
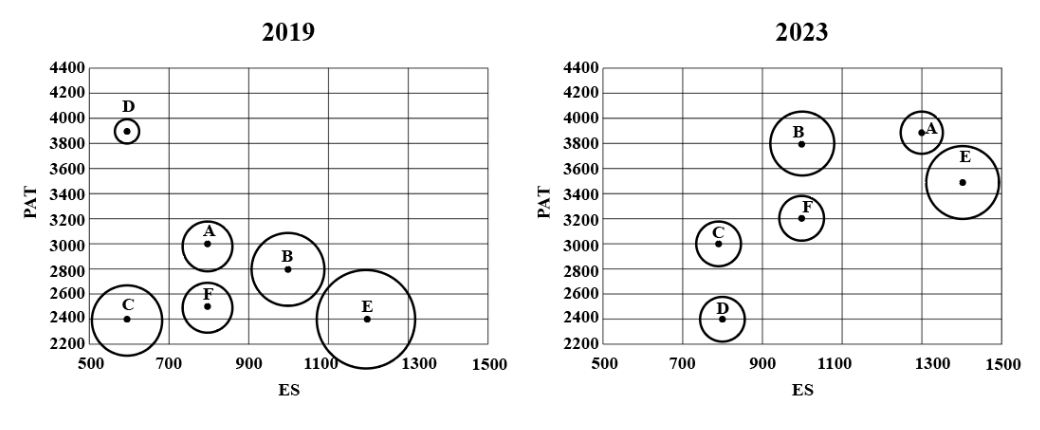
The two plots below give the following information about six firms A, B, C, D, E, and F for 2019 and 2023.
PAT: The firm's profits after taxes in Rs. crores,
ES: The firm's employee strength, that is the number of employees in the firm, and
PRD: The percentage of the firm's PAT that they spend on Research and Development (R&D).
In the plots, the horizontal and vertical coordinates of point representing each firm gives their ES and PAT values respectively. The PRD values of each firm are proportional to the areas around the points representing each firm. The areas are comparable between the two plots, i.e., equal areas in the two plots represent the same PRD values for the two years.
Assume that the annual rate of growth in PAT over the previous year (ARG) remained constant over the
years for each of the six firms. Which among the firms A, B, C, and E had the highest ARG?
Video Explanation
The ratio of the amount of money spent by Firm C on R&D in 2019 to that in 2023 is closest to
Video Explanation
Which among the firms A, C, E, and F had the maximum PAT per employee in 2023?
Video Explanation
Which among the firms C, D, E, and F had the least amount of R&D spending per employee in 2023?
Video Explanation
An online e-commerce firm receives daily integer product ratings from 1 through 5 given by buyers. The daily
average is the average of the ratings given on that day. The cumulative average is the average of all ratings
given on or before that day. The rating system began on Day 1, and the cumulative averages were 3 and 3.1 at
the end of Day 1 and Day 2, respectively. The distribution of ratings on Day 2 is given in the figure below.

The following information is known about ratings on Day 3.
1. 100 buyers gave product ratings on Day 3.
2. The modes of the product ratings were 4 and 5.
3. The numbers of buyers giving each product rating are non-zero multiples of 10.
4. The same number of buyers gave product ratings of 1 and 2, and that number is half the number of buyers
who gave a rating of 3.
How many buyers gave ratings on Day 1?
Video Explanation
What is the median of all ratings given on Day 3?
Video Explanation
Which of the following is true about the cumulative average ratings of Day 2 and Day 3?
Video Explanation
How many buyers gave ratings on Day 1?
Video Explanation
Which of the following is true about the cumulative average ratings of Day 2 and Day 3?
Video Explanation
What is the median of all ratings given on Day 3?
Video Explanation
One person enters the gated area and decides to walk as much as possible before leaving the area without
walking along any path more than once and always walking next to one of the lakes. Note that he may
cross a point multiple times. How much distance (in m) will he walk within the gated area?
Video Explanation
One resident whose house is located at L, needs to visit the post office as well as the bank. What is the
minimum distance (in m) he has to walk starting from his residence and returning to his residence after
visiting both the post office and the bank?
Video Explanation
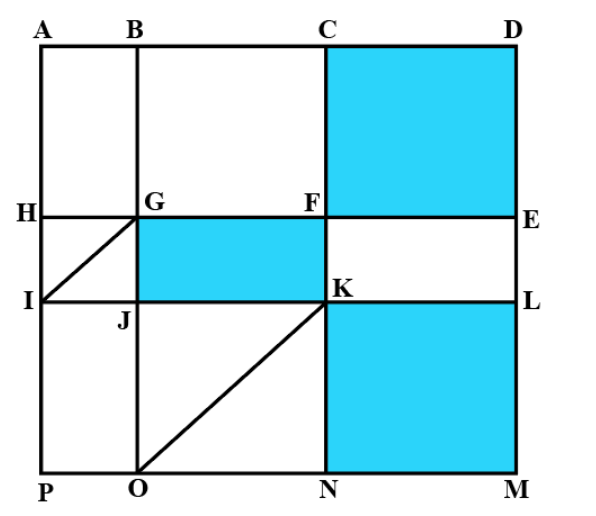
The above is a schematic diagram of walkways (indicated by all the straight-lines) and lakes (3 of them, each in
the shape of rectangles - shaded in the diagram) of a gated area. Different points on the walkway are indicated
by letters (A through P) with distances being OP = 150 m, ON = MN = 300 m, ML = 400 m, EL = 200 m, DE = 400m.
The following additional information about the facilities in the area is known.
1. The only entry/exit point is at C.
2. There are many residences within the gated area; all of them are located on the path AH and ML with four of
them being at A, H, M, and L.
3. The post office is located at P and the bank is located at B
One resident whose house is located at L, needs to visit the post office as well as the bank. What is the
minimum distance (in m) he has to walk starting from his residence and returning to his residence after
visiting both the post office and the bank?
Video Explanation
One person enters the gated area and decides to walk as much as possible before leaving the area without
walking along any path more than once and always walking next to one of the lakes. Note that he may
cross a point multiple times. How much distance (in m) will he walk within the gated area?
Video Explanation
What is the sum of the numbers placed in Column 4?
Video Explanation
For how many slots in the grid, placement of numbers CANNOT be determined with certainty?
Video Explanation
Previous year papers
2024

2023
2022
2021
2020
2019
2018