Live Updates
• CATKing has launched new chat bot.

• New video on Logs has been released.
13.2K
Learners
asked the doubt

Previous Year Questions
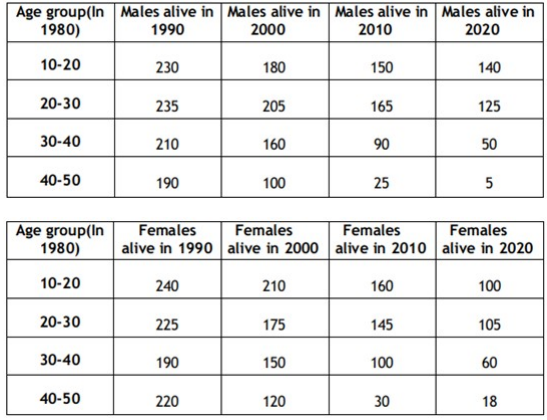
How many individuals who were being tracked and who were less than 30 years of age in 1980 survived until 2020?
Video Explanation

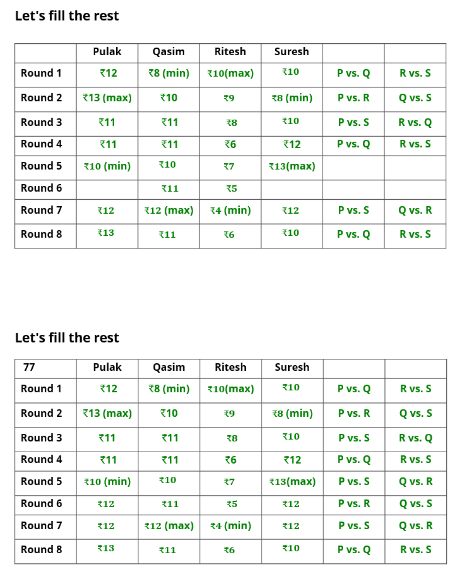
Which of the following pairings was made in Round 5?
Video Explanation

In 2000, what was the ratio of the number of dead males to dead females among those being tracked?
Video Explanation

How many people who were being tracked and who were between 30 and 40 years of age in 1980 survived until 2010?
Video Explanation

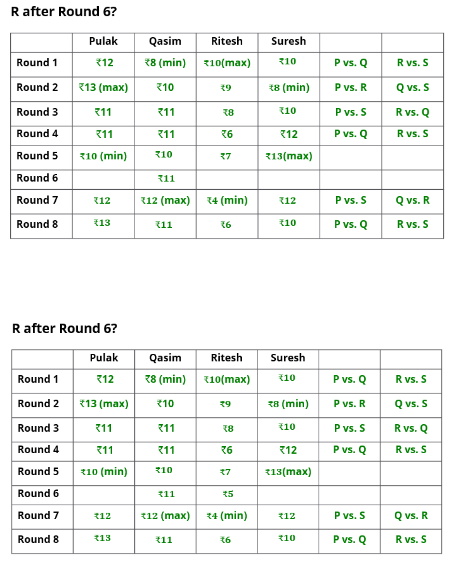
What BEST can be said about the amount of money that Pulak had with him at the end of Round 6?
Video Explanation

How much money (in ₹) did Ritesh have at the end of Round 4?
Video Explanation

How many games were played with a bet of ₹2?
Video Explanation

What BEST can be said about the amount of money that Ritesh had with him at the end of Round 8?
Video Explanation

Read the following information carefully, analyze it, and answer the question based on it.
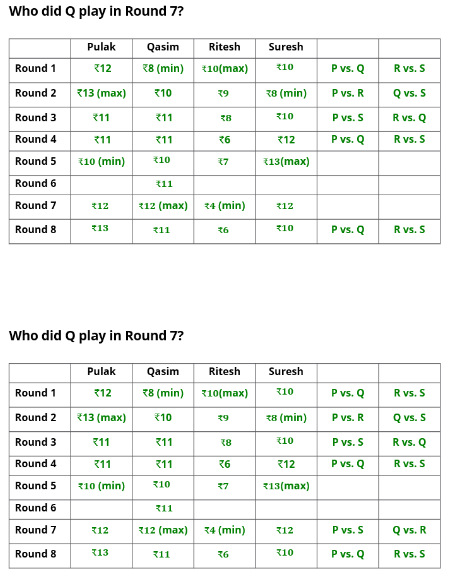
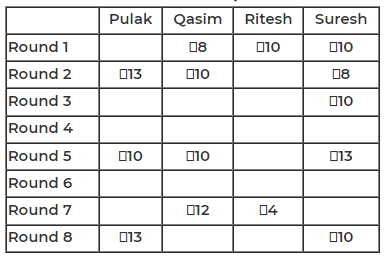
Pulak, Qasim, Ritesh, and Suresh participated in a tournament comprising of eight rounds. In each round, they formed two pairs, with each of them being in exactly one pair. The only restriction in the pairing was that the pairs would change in successive rounds. For example, if Pulak formed a pair with Qasim in the first round, then he would have to form a pair with Ritesh or Suresh in the second round. He would be free to pair with Qasim again in the third round. In each round, each pair decided whether to play the game in that round or not. If they decided not to play, then no money was exchanged between them. If they decided to play, they had to bet either ₹1 or ₹2 in that round. For example, if they chose to bet ₹2, then the player winning the game got ₹2 from the one losing the game.
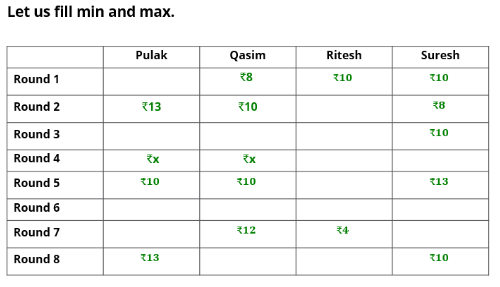
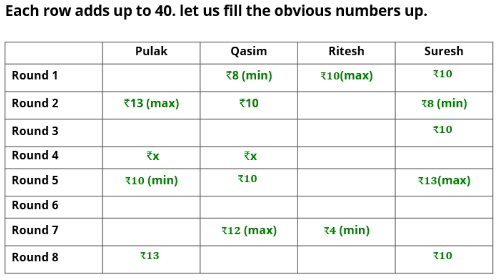
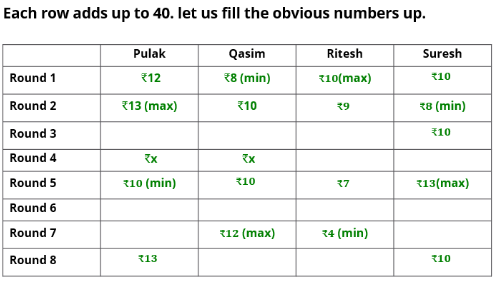
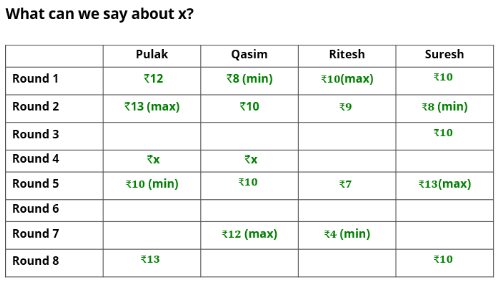
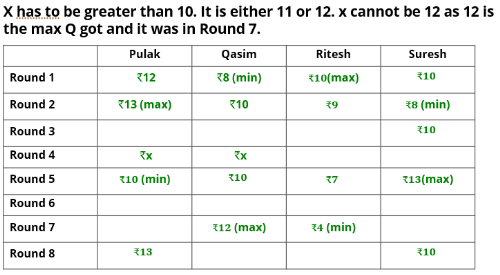
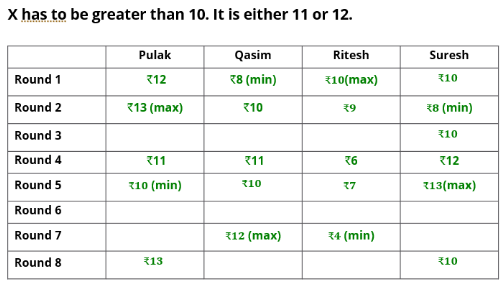
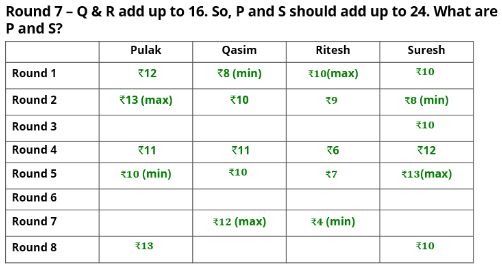
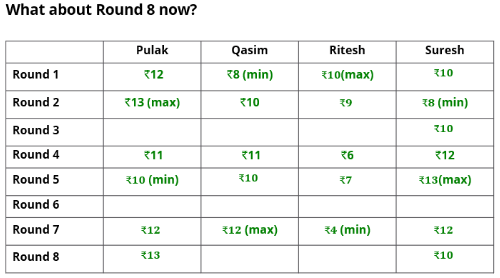
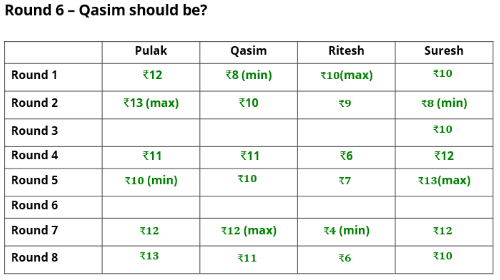
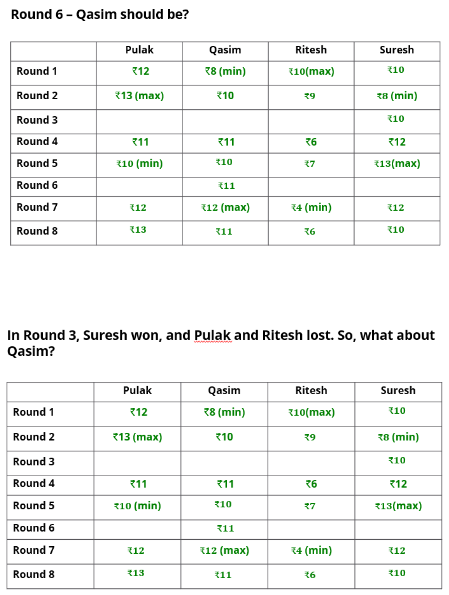
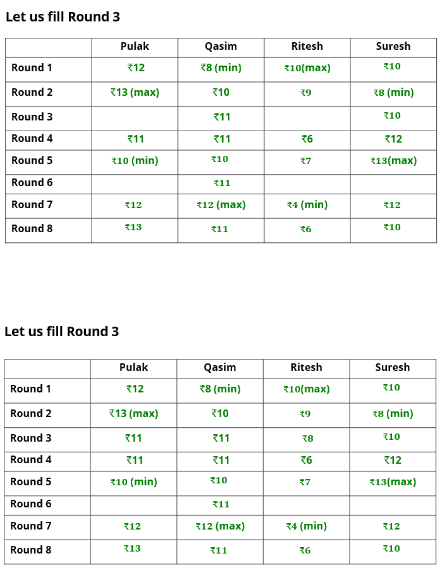
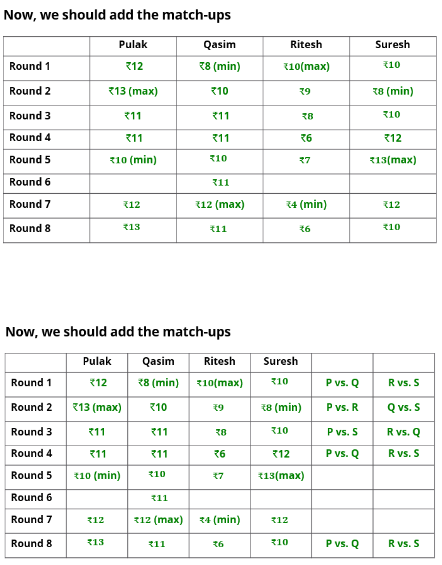
At the beginning of the tournament, the players had ₹10 each. The following table shows partial information about the amounts that the players had at the end of each of the eight rounds. It shows every time a player had ₹10 at the end of a round, as well as every time, at the end of a round, a player had either the minimum or the maximum amount that he would have had across the eight rounds. For example, Suresh had ₹10 at the end of Rounds 1, 3, and 8 and not after any of the other rounds. The maximum amount that he had at the end of any round was ₹13 (at the end of Round 5), and the minimum amount he had at the end of any round was ₹8 (at the end of Round 2). At the end of all other rounds, he must have had either ₹9, ₹11, or ₹12.
It was also known that Pulak and Qasim had the same amount of money with them at the end of Round 4.
What BEST can be said about the amount of money that Ritesh had with him at the end of Round 8?
Video Explanation

What BEST can be said about the amount of money that Pulak had with him at the end of Round 6?
Video Explanation

How much money (in ₹) did Ritesh have at the end of Round 4?
Video Explanation

How many games were played with a bet of ₹2?
Video Explanation

Which of the following pairings was made in Round 5?
Video Explanation

In 2000, what was the ratio of the number of dead males to dead females among those being tracked?
Video Explanation

How many people who were being tracked and who were between 30 and 40 years of age in 1980 survived until 2010?
Video Explanation

Read the following information carefully, analyze it, and answer the question based on it.
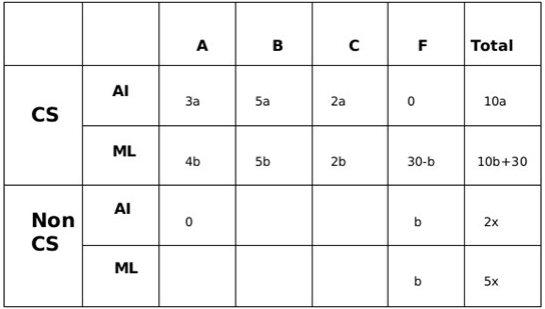
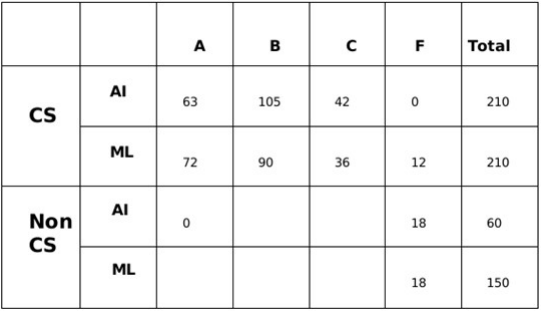
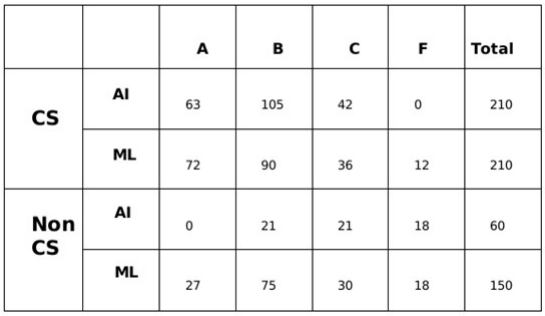
All the first-year students in the computer science (CS) department in a university take both the courses (i) AI and (ii) ML. Students from other departments (non-CS students) can also take one of these two courses, but not both. Students who fail in a course get an F grade; others pass and are awarded A or B or C grades depending on their performance. The following are some additional facts about the number of students who took these two courses this year and the grades they obtained.
1. The numbers of non-CS students who took AI and ML were in the ratio 2 : 5.
2. The number of non-CS students who took either AI or ML was equal to the number of CS students.
3. The numbers of non-CS students who failed in the two courses were the same and their total is equal to the number of CS students who got a C grade in ML.
4. In both the courses, 50% of the students who passed got a B grade. But, while the numbers of students who got A and C grades were the same for AI, they were in the ratio 3 : 2 for ML.
5. No CS student failed in AI, while no non-CS student got an A grade in AI.
6. The numbers of CS students who got A, B and C grades respectively in AI were in the ratio 3 : 5 : 2, while in ML the ratio was 4 : 5 : 2.
7. The ratio of the total number of non-CS students failing in one of the two courses to the number of CS students failing in one of the two courses was 3 : 1.
8. 30 students failed in ML.
How many CS students failed in ML?
Video Explanation

How many non-CS students got A grade in ML?
Video Explanation

How many CS students failed in ML?
Video Explanation

How many non-CS students got A grade in ML?
Video Explanation

Read the following information carefully, analyze it, and answer the question based on it.
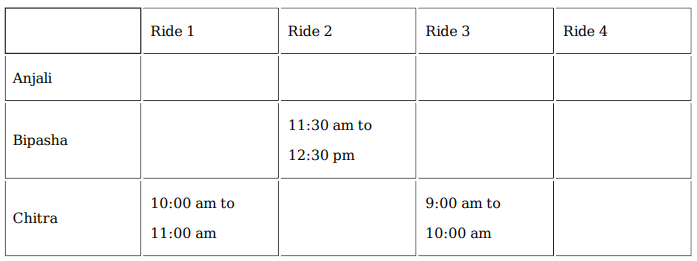
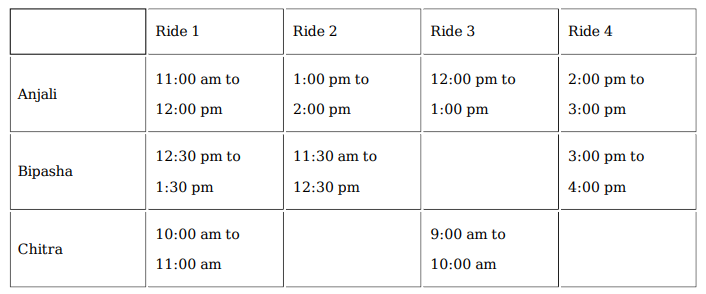
Anjali, Bipasha, and Chitra visited an entertainment park that has four rides. Each ride lasts one hour and can accommodate one visitor at one point. All rides begin at 9 am and must be completed by 5 pm except for Ride-3, for which the last ride has to be completed by 1 pm. Ride gates open every 30 minutes, e.g. 10 am, 10:30 am, and so on. Whenever a ride gate opens, and there is no visitor inside, the first visitor waiting in the queue buys the ticket just before taking the ride. The ticket prices are Rs. 20, Rs. 50, Rs. 30 and Rs. 40 for Rides 1 to 4, respectively. Each of the three visitors took at least one ride and did not necessarily take all rides. None of them took the same ride more than once. The movement time from one ride to another is negligible, and a visitor leaves the ride immediately after the completion of the ride. No one takes a break inside the park unless mentioned explicitly.
The following information is also known.
1. Chitra never waited in the queue and completed her visit by 11 am after spending Rs. 50 to pay for the ticket(s).
2. Anjali took Ride-1 at 11 am after waiting for 30 mins for Chitra to complete it. It was the only ride where Anjali waited.
3. Bipasha began her first of three rides at 11:30 am. All three visitors incurred the same amount of ticket expense by 12:15 pm.
4. The last ride taken by Anjali and Bipasha was the same, where Bipasha waited 30 mins for Anjali to complete her ride. Before standing in the queue for that ride, Bipasha took a 1-hour coffee break after completing her previous ride.
What was the total amount spent on tickets (in Rs.) by Bipasha?
Video Explanation

Which were all the rides that Anjali completed by 2:00 pm?
Video Explanation

How many rides did Anjali and Chitra take in total?
Video Explanation

What was the total amount spent on tickets (in Rs.) by Anjali?
Video Explanation

What was the total amount spent on tickets (in Rs.) by Bipasha?
Video Explanation

Which were all the rides that Anjali completed by 2:00 pm?
Video Explanation

How many rides did Anjali and Chitra take in total?
Video Explanation

What was the total amount spent on tickets (in Rs.) by Anjali?
Video Explanation

What best can be concluded about the total amount of money raised in 2015?
Video Explanation

What is the largest possible total amount of money (in Rs. crores) that could have been raised in 2013?
Video Explanation

If Elavalaki raised Rs. 3 crores in 2013, then what is the smallest possible total amount of money (in Rs. crores) that could have been raised by all the companies in 2012?
Video Explanation

If the total amount of money raised in 2014 is Rs. 12 crores, then which of the following is not possible?
Video Explanation

Read the following information carefully, analyze it, and answer the question based on it.
Odsville has five firms – Alfloo, Bzygoo, Czechy, Drjbna and Elavalaki. Each of these firms was founded in some year and also closed down a few years later.
Each firm raised Rs. 1 crore in its first and last year of existence. The amount each firm raised every year increased until it reached a maximum, and then decreased until the firm closed down. No firm raised the same amount of money in two consecutive years. Each annual increase and decrease was either by Rs. 1 crore or by Rs. 2 crores.
The table below provides partial information about the five firms.
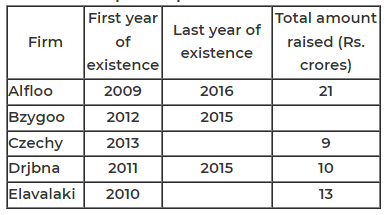
For which firm(s) can the amounts raised by them be concluded with certainty in each year?
Video Explanation

What best can be concluded about the total amount of money raised in 2015?
Video Explanation

What is the largest possible total amount of money (in Rs. crores) that could have been raised in 2013?
Video Explanation

If Elavalaki raised Rs. 3 crores in 2013, then what is the smallest possible total amount of money (in Rs. crores) that could have been raised by all the companies in 2012?
Video Explanation

If the total amount of money raised in 2014 is Rs. 12 crores, then which of the following is not possible?
Video Explanation

For which firm(s) can the amounts raised by them be concluded with certainty in each year?
Video Explanation

Read the following information carefully, analyze it, and answer the question based on it.
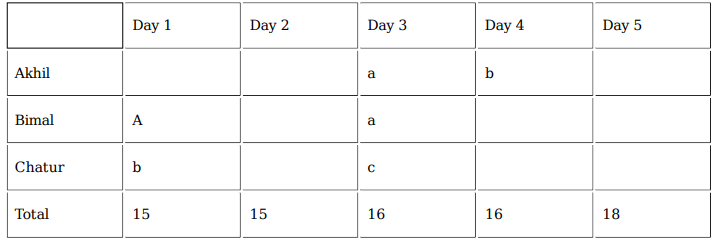
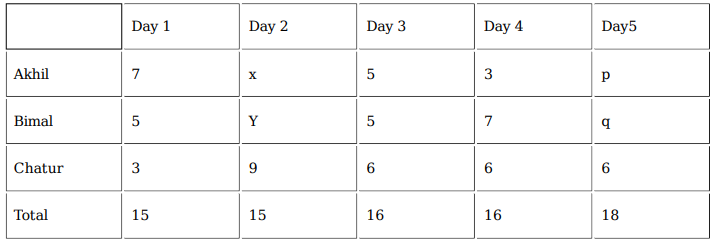
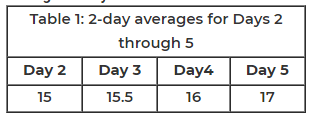
Three participants – Akhil, Bimal and Chatur participate in a random draw competition for five days. Every day, each participant randomly picks up a ball numbered between 1 and 9. The number on the ball determines his score on that day. The total score of a participant is the sum of his scores attained in the five days. The total score of a day is the sum of participants' scores on that day. The 2-day average on a day, except on Day 1, is the average of the total scores of that day and of the previous day. For example, if the total scores of Day 1 and Day 2 are 25 and 20, then the 2-day average on Day 2 is calculated as 22.5. Table 1 gives the 2-day averages for Days 2 through 5.
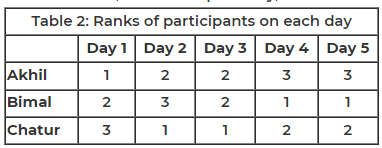
Participants are ranked each day, with the person having the maximum score being awarded the minimum rank (1) on that day. If there is a tie, all participants with the tied score are awarded the best available rank. For example, if on a day Akhil, Bimal, and Chatur score 8, 7 and 7 respectively, then their ranks will be 1, 2 and 2 respectively on that day. These ranks are given in Table 2.
The following information is also known.
1. Chatur always scores in multiples of 3. His score on Day 2 is the unique highest score in the competition. His minimum score is observed only on Day 1, and it matches Akhil's score on Day 4.
2. The total score on Day 3 is the same as the total score on Day 4.
3. Bimal's scores are the same on Day 1 and Day 3.
What is the minimum possible total score of Bimal?
Video Explanation

If the total score of Bimal is a multiple of 3, what is the score of Akhil on Day 2?
Video Explanation

If Akhil attains a total score of 24, then what is the total score of Bimal?
Video Explanation

What is the minimum possible total score of Bimal?
Video Explanation

If the total score of Bimal is a multiple of 3, what is the score of Akhil on Day 2?
Video Explanation

If Akhil attains a total score of 24, then what is the total score of Bimal?
Video Explanation

Read the following information carefully, analyze it, and answer the question based on it.
There are nine boxes arranged in a 3×3 array as shown in Tables 1 and 2. Each box contains three sacks. Each sack has a certain number of coins, between 1 and 9, both inclusive.
The average number of coins per sack in the boxes are all distinct integers. The total number of coins in each row is the same. The total number of coins in each column is also the same.
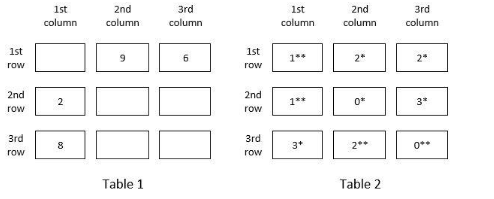
Table 1 gives information regarding the median of the numbers of coins in the three sacks in a box for some of the boxes. In Table 2 each box has a number which represents the number of sacks in that box having more than 5 coins. That number is followed by a * if the sacks in that box satisfy exactly one among the following three conditions, and it is followed by ** if two or more of these conditions are satisfied.
i) The minimum among the numbers of coins in the three sacks in the box is 1.
ii) The median of the numbers of coins in the three sacks is 1.
iii) The maximum among the numbers of coins in the three sacks in the box is 9.
What is the total number of coins in all the boxes in the 3rd row?
Video Explanation

How many boxes have at least one sack containing 9 coins?
Video Explanation

How many sacks have exactly one coin?
Video Explanation

In how many boxes do all three sacks contain different numbers of coins?
Video Explanation

What is the total number of coins in all the boxes in the 3rd row?
Video Explanation

How many boxes have at least one sack containing 9 coins?
Video Explanation

How many sacks have exactly one coin?
Video Explanation

In how many boxes do all three sacks contain different numbers of coins?
Video Explanation

Profit per employee is the ratio of a company's profit to its employee strength. For this purpose, the employee strength in a year is the average of the employee strength at the beginning of that year and the beginning of the next year. In 2020, which of the four companies had the highest profit per employee?
Video Explanation

The two plots below show data for four companies code-named A, B, C, and D over three years - 2019, 2020, and 2021.
The first plot shows the revenues and costs incurred by the companies during these years. For example, in 2021, company C earned Rs.100 crores in revenue and spent Rs.30 crores. The profit of a company is defined as its revenue minus its costs.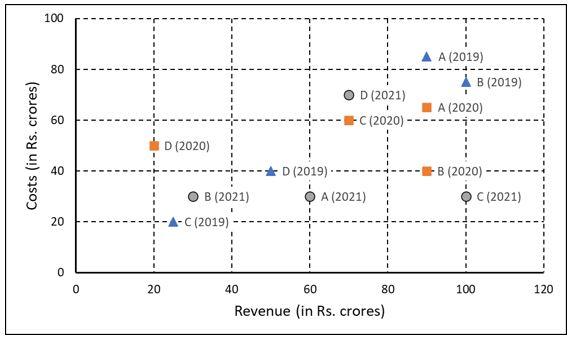
The second plot shows the number of employees employed by the company (employee strength) at the start of each of these three years, as well as the number of new employees hired each year (new hires). For example, Company B had 250 employees at the start of 2021, and 30 new employees joined the company during the year.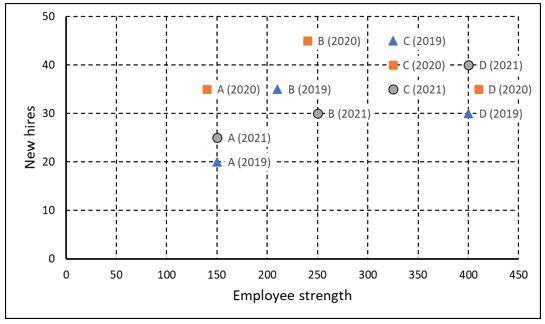
Considering all three years, which company had the highest annual profit?
Video Explanation

Which of the four companies experienced the highest annual loss in any of the years?
Video Explanation

The ratio of a company's annual profit to its annual costs is a measure of its performance. Which of the four companies had the lowest value of this ratio in 2019?
Video Explanation

The total number of employees lost in 2019 and 2020 was the least for:
Video Explanation

Profit per employee is the ratio of a company's profit to its employee strength. For this purpose, the employee strength in a year is the average of the employee strength at the beginning of that year and the beginning of the next year. In 2020, which of the four companies had the highest profit per employee?
Video Explanation

Considering all three years, which company had the highest annual profit?
Video Explanation

Which of the four companies experienced the highest annual loss in any of the years?
Video Explanation

The ratio of a company's annual profit to its annual costs is a measure of its performance. Which of the four companies had the lowest value of this ratio in 2019?
Video Explanation

The total number of employees lost in 2019 and 2020 was the least for:
Video Explanation

A speciality supermarket sells 320 products. Each of these products was either a cosmetic product or a nutrition product. Each of these products was also either a foreign product or a domestic product. Each of these products had at least one of the two approvals – FDA or EU.
The following facts are also known:
1. There were equal numbers of domestic and foreign products.
2. Half of the domestic products were FDA approved cosmetic products.
3. None of the foreign products had both the approvals, while 60 domestic products had both the approvals.
4. There were 140 nutrition products, half of them were foreign products.
5. There were 200 FDA approved products. 70 of them were foreign products and 120 of them were cosmetic products.
How many foreign products were FDA approved cosmetic products?
Video Explanation

How many cosmetic products did not have FDA approval?
Video Explanation

Which among the following options best represents the number of domestic cosmetic products that had both the approvals?
Video Explanation

If 70 cosmetic products did not have EU approval, then how many nutrition products had both the approvals?
Video Explanation

If 50 nutrition products did not have EU approval, then how many domestic cosmetic products did not have EU approval?
Video Explanation

How many foreign products were FDA approved cosmetic products?
Video Explanation

How many cosmetic products did not have FDA approval?
Video Explanation

Previous year papers
2024
2023
2022
2021
2020
2019
2018

