Previous Year Questions

Live Updates

• CATKing has launched new chat bot.

• New video on Logs has been released.

419 Learners
asked the doubt

Previous Year Questions

    653.


    Option D is the correct answer.

    Video Explanation

    Explanatory Answer

    656.


    Answer : 44

    Video Explanation

    Explanatory Answer

    658.

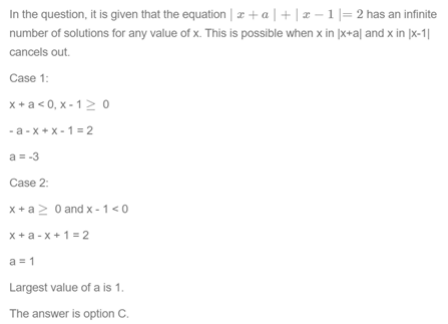
    The largest real value of a for which the equation |x+a|+|x−1|=2 has an infinite number of solutions for x is

    Option C is the correct answer.

    Video Explanation

    Explanatory Answer


    661.

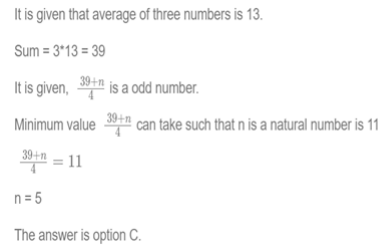
    The average of three integers is 13 . When a natural number n is included, the average of these four integers remains an odd integer. The minimum possible value of n is

    Option C is the correct answer.

    Video Explanation

    Explanatory Answer

    663.


    Option B is the correct answer.

    Video Explanation

    Explanatory Answer


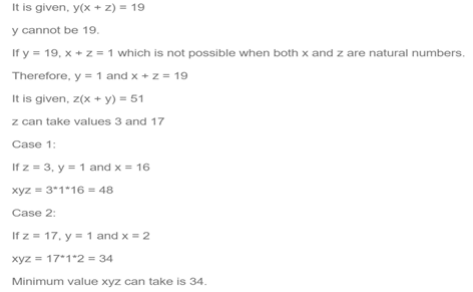
    664.


    Answer : 34

    Video Explanation

    Explanatory Answer


    667.

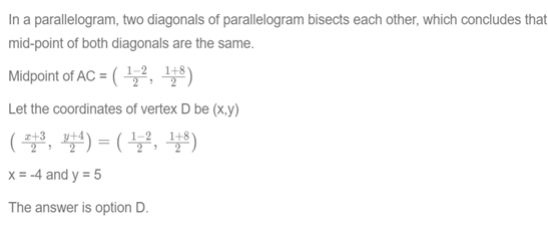
    Let ABCD be a parallelogram such that the coordinates of its three vertices A, B, C are (1, 1), (3, 4) and (−2, 8), respectively. Then, the coordinates of the vertex D are

    Option D is the correct answer.

    Video Explanation

    Explanatory Answer


    668.

    Read the following information carefully, analyze it, and answer the question based on it. 


    There are only four neighbourhoods in a city - Levmisto, Tyhrmisto, Pesmisto and Kitmisto. During the onset of a pandemic, the number of new cases of a disease in each of these neighbourhoods was recorded over a period of five days. On each day, the number of new cases recorded in any of the neighbourhoods was either 0, 1, 2 or 3.

    The following facts are also known:

    1. There was at least one new case in every neighbourhood on Day 1.
    2. On each of the five days, there were more new cases in Kitmisto than in Pesmisto.
    3. The number of new cases in the city in a day kept increasing during the five-day period. The number of new cases on Day 3 was exactly one more than that on Day 2.
    4. The maximum number of new cases in a day in Pesmisto was 2, and this happened only once during the five-day period.
    5. Kitmisto is the only place to have 3 new cases on Day 2.
    6. The total numbers of new cases in Levmisto, Tyhrmisto, Pesmisto and Kitmisto over the five-day period were 12, 12, 5 and 14 respectively.

    651.

    What BEST can be concluded about the total number of new cases in the city on Day 2?

    Option B is the correct answer.

    Video Explanation

    Explanatory Answer

    From statement 6, it can be concluded that the total number of new cases is equal to 12+12+5+14 = 43.


    Also, since the total number of cases in Kitmisto is 14, it can be concluded that the number of cases each day is either 2 or 3, where 3 cases are recorded on 4 days and 2 cases are recorded on 1 day.


    From statement 4, it can be concluded that the number of new cases for Pesmisto will be 0,1,1,1, and 2, in any order(Since the total number of cases is 5, and the maximum number of new cases is 2).


    In statement 3, it is given that the number of new cases kept increasing during the 5-day period.


    Now, as it is already known that the maximum number of cases for Pesmisto is 2, the maximum total number of cases in a day(or on day 5) will be less than 12.


    Let us consider the maximum number of cases on Day 5 as 10. 


    Thus the maximum number of cases possible for the remaining days will be 9, 8, 7, and 6. So, the total number of maximum cases possible for this case will be 40(less than 43).


    Thus, the number of cases on Day 5 will be 11(i.e., b/w 10 and 11)


    Now, if the number of cases on Day 4 is 9, the maximum number of cases possible for the remaining days will be 8, 7, and 6. Thus, the maximum number of cases, in this case, will be 41(less than 43).


    So, the number of cases on day 4 will be 10.


    Now, if the number of cases on Day 3 is 8, the number of cases on day 2 will be 7, and the maximum possible number of cases on Day 1 will be 6.


    Thus, the number of cases, in this case, will be 42(less than 43).


    Thus, the number of cases on day 3 will be 9, the number of cases on day 2 will be 8, and the number of cases on day 1 will be 5.


    Screenshot_74.png     


    Since all the neighbourhood has at least one case on Day 1, the only possible combination will be 1, 1, 1, and 2 for Levmisto, Tyhrmisto, Pesmisto and Kitmisto, respectively.


    Now, for the other 4 days, the number of cases in Kitmisto will be 3.


    For day 5, the number of cases will be 3, 3, 2, and 3 for Levmisto, Tyhrmisto, Pesmisto and Kitmisto, respectively(since the maximum number of cases in Pesmisto is 2).


    And since Pesmisto only has the maximum number of cases on one day, the number of cases on day 4 will be 3, 3, 1, and 3 for Levmisto, Tyhrmisto, Pesmisto and Kitmisto, respectively.


    On day 2, since Kitmisto is the only neighbourhood to have 3 cases, the number of cases on day 2 will be 2, 2, 1, and 3 for Levmisto, Tyhrmisto, Pesmisto and Kitmisto, respectively.


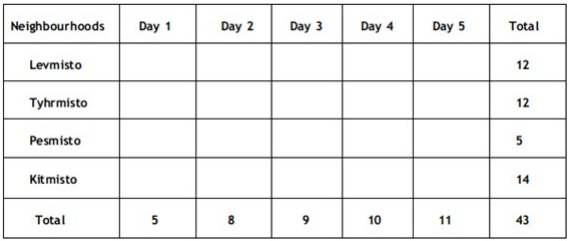
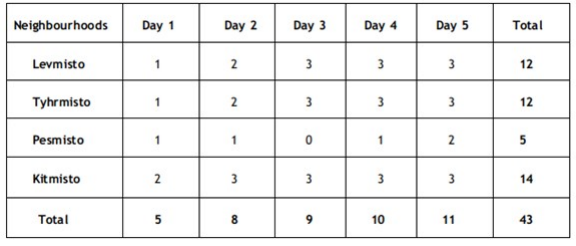
    Now, on day 3, the number of cases will be 3, 3, 0, and 3 for Levmisto, Tyhrmisto, Pesmisto and Kitmisto, respectively. Thus, the final table will be as follows: 


    Screenshot_75.png     


    From the data, it can be concluded that the total number of cases on Day 2 is equal to 8. Thus, the correct option is D.

    652.

    What BEST can be concluded about the number of new cases in Levmisto on Day 3?

    Option A is the correct answer.

    Video Explanation

    Explanatory Answer

    From statement 6, it can be concluded that the total number of new cases is equal to 12+12+5+14 = 43.


    Also, since the total number of cases in Kitmisto is 14, it can be concluded that the number of cases each day is either 2 or 3, where 3 cases are recorded on 4 days and 2 cases are recorded on 1 day.


    From statement 4, it can be concluded that the number of new cases for Pesmisto will be 0,1,1,1, and 2, in any order(Since the total number of cases is 5, and the maximum number of new cases is 2).


    In statement 3, it is given that the number of new cases kept increasing during the 5-day period.


    Now, as it is already known that the maximum number of cases for Pesmisto is 2, the maximum total number of cases in a day(or on day 5) will be less than 12.


    Let us consider the maximum number of cases on Day 5 as 10. 


    Thus the maximum number of cases possible for the remaining days will be 9, 8, 7, and 6. So, the total number of maximum cases possible for this case will be 40(less than 43).


    Thus, the number of cases on Day 5 will be 11(i.e., b/w 10 and 11)


    Now, if the number of cases on Day 4 is 9, the maximum number of cases possible for the remaining days will be 8, 7, and 6. Thus, the maximum number of cases, in this case, will be 41(less than 43).


    So, the number of cases on day 4 will be 10.


    Now, if the number of cases on Day 3 is 8, the number of cases on day 2 will be 7, and the maximum possible number of cases on Day 1 will be 6.


    Thus, the number of cases, in this case, will be 42(less than 43).


    Thus, the number of cases on day 3 will be 9, the number of cases on day 2 will be 8, and the number of cases on day 1 will be 5.


    Screenshot_74.png     


    Since all the neighbourhood has at least one case on Day 1, the only possible combination will be 1, 1, 1, and 2 for Levmisto, Tyhrmisto, Pesmisto and Kitmisto, respectively.


    Now, for the other 4 days, the number of cases in Kitmisto will be 3.


    For day 5, the number of cases will be 3, 3, 2, and 3 for Levmisto, Tyhrmisto, Pesmisto and Kitmisto, respectively(since the maximum number of cases in Pesmisto is 2).


    And since Pesmisto only has the maximum number of cases on one day, the number of cases on day 4 will be 3, 3, 1, and 3 for Levmisto, Tyhrmisto, Pesmisto and Kitmisto, respectively.


    On day 2, since Kitmisto is the only neighbourhood to have 3 cases, the number of cases on day 2 will be 2, 2, 1, and 3 for Levmisto, Tyhrmisto, Pesmisto and Kitmisto, respectively.


    Now, on day 3, the number of cases will be 3, 3, 0, and 3 for Levmisto, Tyhrmisto, Pesmisto and Kitmisto, respectively. Thus, the final table will be as follows: 


    Screenshot_75.png     

    From the final table, it can be concluded that the total number of cases in Levmisto is 3 on day 3.
    Thus, the correct option is C.

    653.

    On which day(s) did Pesmisto not have any new case?

    Option A is the correct answer.

    Video Explanation

    Explanatory Answer

    From statement 6, it can be concluded that the total number of new cases is equal to 12+12+5+14 = 43.


    Also, since the total number of cases in Kitmisto is 14, it can be concluded that the number of cases each day is either 2 or 3, where 3 cases are recorded on 4 days and 2 cases are recorded on 1 day.


    From statement 4, it can be concluded that the number of new cases for Pesmisto will be 0,1,1,1, and 2, in any order(Since the total number of cases is 5, and the maximum number of new cases is 2).


    In statement 3, it is given that the number of new cases kept increasing during the 5-day period.


    Now, as it is already known that the maximum number of cases for Pesmisto is 2, the maximum total number of cases in a day(or on day 5) will be less than 12.


    Let us consider the maximum number of cases on Day 5 as 10. 


    Thus the maximum number of cases possible for the remaining days will be 9, 8, 7, and 6. So, the total number of maximum cases possible for this case will be 40(less than 43).


    Thus, the number of cases on Day 5 will be 11(i.e., b/w 10 and 11)


    Now, if the number of cases on Day 4 is 9, the maximum number of cases possible for the remaining days will be 8, 7, and 6. Thus, the maximum number of cases, in this case, will be 41(less than 43).


    So, the number of cases on day 4 will be 10.


    Now, if the number of cases on Day 3 is 8, the number of cases on day 2 will be 7, and the maximum possible number of cases on Day 1 will be 6.


    Thus, the number of cases, in this case, will be 42(less than 43).


    Thus, the number of cases on day 3 will be 9, the number of cases on day 2 will be 8, and the number of cases on day 1 will be 5.


    Screenshot_74.png     


    Since all the neighbourhood has at least one case on Day 1, the only possible combination will be 1, 1, 1, and 2 for Levmisto, Tyhrmisto, Pesmisto and Kitmisto, respectively.


    Now, for the other 4 days, the number of cases in Kitmisto will be 3.


    For day 5, the number of cases will be 3, 3, 2, and 3 for Levmisto, Tyhrmisto, Pesmisto and Kitmisto, respectively(since the maximum number of cases in Pesmisto is 2).


    And since Pesmisto only has the maximum number of cases on one day, the number of cases on day 4 will be 3, 3, 1, and 3 for Levmisto, Tyhrmisto, Pesmisto and Kitmisto, respectively.


    On day 2, since Kitmisto is the only neighbourhood to have 3 cases, the number of cases on day 2 will be 2, 2, 1, and 3 for Levmisto, Tyhrmisto, Pesmisto and Kitmisto, respectively.


    Now, on day 3, the number of cases will be 3, 3, 0, and 3 for Levmisto, Tyhrmisto, Pesmisto and Kitmisto, respectively. Thus, the final table will be as follows: 


    Screenshot_75.png     


    From the final table, it can be concluded that on Day 3, the number of cases will be zero for Pesmisto. Thus, the correct option is A. 

    654.

    Which of the two statements below is/are necessarily false?
    Statement A: There were 2 new cases in Tyhrmisto on Day 3.
    Statement B: There were no new cases in Pesmisto on Day 2.

    Option B is the correct answer.

    Video Explanation

    Explanatory Answer

    From statement 6, it can be concluded that the total number of new cases is equal to 12+12+5+14 = 43.


    Also, since the total number of cases in Kitmisto is 14, it can be concluded that the number of cases each day is either 2 or 3, where 3 cases are recorded on 4 days and 2 cases are recorded on 1 day.


    From statement 4, it can be concluded that the number of new cases for Pesmisto will be 0,1,1,1, and 2, in any order(Since the total number of cases is 5, and the maximum number of new cases is 2).


    In statement 3, it is given that the number of new cases kept increasing during the 5-day period.


    Now, as it is already known that the maximum number of cases for Pesmisto is 2, the maximum total number of cases in a day(or on day 5) will be less than 12.


    Let us consider the maximum number of cases on Day 5 as 10. 


    Thus the maximum number of cases possible for the remaining days will be 9, 8, 7, and 6. So, the total number of maximum cases possible for this case will be 40(less than 43).


    Thus, the number of cases on Day 5 will be 11(i.e., b/w 10 and 11)


    Now, if the number of cases on Day 4 is 9, the maximum number of cases possible for the remaining days will be 8, 7, and 6. Thus, the maximum number of cases, in this case, will be 41(less than 43).


    So, the number of cases on day 4 will be 10.


    Now, if the number of cases on Day 3 is 8, the number of cases on day 2 will be 7, and the maximum possible number of cases on Day 1 will be 6.


    Thus, the number of cases, in this case, will be 42(less than 43).


    Thus, the number of cases on day 3 will be 9, the number of cases on day 2 will be 8, and the number of cases on day 1 will be 5.


    Screenshot_74.png     


    Since all the neighbourhood has at least one case on Day 1, the only possible combination will be 1, 1, 1, and 2 for Levmisto, Tyhrmisto, Pesmisto and Kitmisto, respectively.


    Now, for the other 4 days, the number of cases in Kitmisto will be 3.


    For day 5, the number of cases will be 3, 3, 2, and 3 for Levmisto, Tyhrmisto, Pesmisto and Kitmisto, respectively(since the maximum number of cases in Pesmisto is 2).


    And since Pesmisto only has the maximum number of cases on one day, the number of cases on day 4 will be 3, 3, 1, and 3 for Levmisto, Tyhrmisto, Pesmisto and Kitmisto, respectively.


    On day 2, since Kitmisto is the only neighbourhood to have 3 cases, the number of cases on day 2 will be 2, 2, 1, and 3 for Levmisto, Tyhrmisto, Pesmisto and Kitmisto, respectively.


    Now, on day 3, the number of cases will be 3, 3, 0, and 3 for Levmisto, Tyhrmisto, Pesmisto and Kitmisto, respectively. Thus, the final table will be as follows: 


    Screenshot_75.png     

    From the final table, it can be concluded that both statements are false. Thus the correct option is D. 


    655.

    On how many days did Levmisto and Tyhrmisto have the same number of new cases?

    Option B is the correct answer.

    Video Explanation

    Explanatory Answer

    From statement 6, it can be concluded that the total number of new cases is equal to 12+12+5+14 = 43.


    Also, since the total number of cases in Kitmisto is 14, it can be concluded that the number of cases each day is either 2 or 3, where 3 cases are recorded on 4 days and 2 cases are recorded on 1 day.


    From statement 4, it can be concluded that the number of new cases for Pesmisto will be 0,1,1,1, and 2, in any order(Since the total number of cases is 5, and the maximum number of new cases is 2).


    In statement 3, it is given that the number of new cases kept increasing during the 5-day period.


    Now, as it is already known that the maximum number of cases for Pesmisto is 2, the maximum total number of cases in a day(or on day 5) will be less than 12.


    Let us consider the maximum number of cases on Day 5 as 10. 


    Thus the maximum number of cases possible for the remaining days will be 9, 8, 7, and 6. So, the total number of maximum cases possible for this case will be 40(less than 43).


    Thus, the number of cases on Day 5 will be 11(i.e., b/w 10 and 11)


    Now, if the number of cases on Day 4 is 9, the maximum number of cases possible for the remaining days will be 8, 7, and 6. Thus, the maximum number of cases, in this case, will be 41(less than 43).


    So, the number of cases on day 4 will be 10.


    Now, if the number of cases on Day 3 is 8, the number of cases on day 2 will be 7, and the maximum possible number of cases on Day 1 will be 6.


    Thus, the number of cases, in this case, will be 42(less than 43).


    Thus, the number of cases on day 3 will be 9, the number of cases on day 2 will be 8, and the number of cases on day 1 will be 5.


    Screenshot_74.png     


    Since all the neighbourhood has at least one case on Day 1, the only possible combination will be 1, 1, 1, and 2 for Levmisto, Tyhrmisto, Pesmisto and Kitmisto, respectively.


    Now, for the other 4 days, the number of cases in Kitmisto will be 3.


    For day 5, the number of cases will be 3, 3, 2, and 3 for Levmisto, Tyhrmisto, Pesmisto and Kitmisto, respectively(since the maximum number of cases in Pesmisto is 2).


    And since Pesmisto only has the maximum number of cases on one day, the number of cases on day 4 will be 3, 3, 1, and 3 for Levmisto, Tyhrmisto, Pesmisto and Kitmisto, respectively.


    On day 2, since Kitmisto is the only neighbourhood to have 3 cases, the number of cases on day 2 will be 2, 2, 1, and 3 for Levmisto, Tyhrmisto, Pesmisto and Kitmisto, respectively.


    Now, on day 3, the number of cases will be 3, 3, 0, and 3 for Levmisto, Tyhrmisto, Pesmisto and Kitmisto, respectively. Thus, the final table will be as follows: 


    Screenshot_75.png     


    It can be concluded from the final table that the number of cases will be the same for all the days.
    Thus, the correct option is D

    669.

    What BEST can be concluded about the total number of new cases in the city on Day 2?

    Option B is the correct answer.

    Video Explanation

    Explanatory Answer

    From statement 6, it can be concluded that the total number of new cases is equal to 12+12+5+14 = 43.


    Also, since the total number of cases in Kitmisto is 14, it can be concluded that the number of cases each day is either 2 or 3, where 3 cases are recorded on 4 days and 2 cases are recorded on 1 day.


    From statement 4, it can be concluded that the number of new cases for Pesmisto will be 0,1,1,1, and 2, in any order(Since the total number of cases is 5, and the maximum number of new cases is 2).


    In statement 3, it is given that the number of new cases kept increasing during the 5-day period.


    Now, as it is already known that the maximum number of cases for Pesmisto is 2, the maximum total number of cases in a day(or on day 5) will be less than 12.


    Let us consider the maximum number of cases on Day 5 as 10. 


    Thus the maximum number of cases possible for the remaining days will be 9, 8, 7, and 6. So, the total number of maximum cases possible for this case will be 40(less than 43).


    Thus, the number of cases on Day 5 will be 11(i.e., b/w 10 and 11)


    Now, if the number of cases on Day 4 is 9, the maximum number of cases possible for the remaining days will be 8, 7, and 6. Thus, the maximum number of cases, in this case, will be 41(less than 43).


    So, the number of cases on day 4 will be 10.


    Now, if the number of cases on Day 3 is 8, the number of cases on day 2 will be 7, and the maximum possible number of cases on Day 1 will be 6.


    Thus, the number of cases, in this case, will be 42(less than 43).


    Thus, the number of cases on day 3 will be 9, the number of cases on day 2 will be 8, and the number of cases on day 1 will be 5.


    Screenshot_74.png     


    Since all the neighbourhood has at least one case on Day 1, the only possible combination will be 1, 1, 1, and 2 for Levmisto, Tyhrmisto, Pesmisto and Kitmisto, respectively.


    Now, for the other 4 days, the number of cases in Kitmisto will be 3.


    For day 5, the number of cases will be 3, 3, 2, and 3 for Levmisto, Tyhrmisto, Pesmisto and Kitmisto, respectively(since the maximum number of cases in Pesmisto is 2).


    And since Pesmisto only has the maximum number of cases on one day, the number of cases on day 4 will be 3, 3, 1, and 3 for Levmisto, Tyhrmisto, Pesmisto and Kitmisto, respectively.


    On day 2, since Kitmisto is the only neighbourhood to have 3 cases, the number of cases on day 2 will be 2, 2, 1, and 3 for Levmisto, Tyhrmisto, Pesmisto and Kitmisto, respectively.


    Now, on day 3, the number of cases will be 3, 3, 0, and 3 for Levmisto, Tyhrmisto, Pesmisto and Kitmisto, respectively. Thus, the final table will be as follows: 


    Screenshot_75.png     


    From the data, it can be concluded that the total number of cases on Day 2 is equal to 8. Thus, the correct option is D.

    670.

    What BEST can be concluded about the number of new cases in Levmisto on Day 3?

    Option A is the correct answer.

    Video Explanation

    Explanatory Answer

    From statement 6, it can be concluded that the total number of new cases is equal to 12+12+5+14 = 43.


    Also, since the total number of cases in Kitmisto is 14, it can be concluded that the number of cases each day is either 2 or 3, where 3 cases are recorded on 4 days and 2 cases are recorded on 1 day.


    From statement 4, it can be concluded that the number of new cases for Pesmisto will be 0,1,1,1, and 2, in any order(Since the total number of cases is 5, and the maximum number of new cases is 2).


    In statement 3, it is given that the number of new cases kept increasing during the 5-day period.


    Now, as it is already known that the maximum number of cases for Pesmisto is 2, the maximum total number of cases in a day(or on day 5) will be less than 12.


    Let us consider the maximum number of cases on Day 5 as 10. 


    Thus the maximum number of cases possible for the remaining days will be 9, 8, 7, and 6. So, the total number of maximum cases possible for this case will be 40(less than 43).


    Thus, the number of cases on Day 5 will be 11(i.e., b/w 10 and 11)


    Now, if the number of cases on Day 4 is 9, the maximum number of cases possible for the remaining days will be 8, 7, and 6. Thus, the maximum number of cases, in this case, will be 41(less than 43).


    So, the number of cases on day 4 will be 10.


    Now, if the number of cases on Day 3 is 8, the number of cases on day 2 will be 7, and the maximum possible number of cases on Day 1 will be 6.


    Thus, the number of cases, in this case, will be 42(less than 43).


    Thus, the number of cases on day 3 will be 9, the number of cases on day 2 will be 8, and the number of cases on day 1 will be 5.


    Screenshot_74.png     


    Since all the neighbourhood has at least one case on Day 1, the only possible combination will be 1, 1, 1, and 2 for Levmisto, Tyhrmisto, Pesmisto and Kitmisto, respectively.


    Now, for the other 4 days, the number of cases in Kitmisto will be 3.


    For day 5, the number of cases will be 3, 3, 2, and 3 for Levmisto, Tyhrmisto, Pesmisto and Kitmisto, respectively(since the maximum number of cases in Pesmisto is 2).


    And since Pesmisto only has the maximum number of cases on one day, the number of cases on day 4 will be 3, 3, 1, and 3 for Levmisto, Tyhrmisto, Pesmisto and Kitmisto, respectively.


    On day 2, since Kitmisto is the only neighbourhood to have 3 cases, the number of cases on day 2 will be 2, 2, 1, and 3 for Levmisto, Tyhrmisto, Pesmisto and Kitmisto, respectively.


    Now, on day 3, the number of cases will be 3, 3, 0, and 3 for Levmisto, Tyhrmisto, Pesmisto and Kitmisto, respectively. Thus, the final table will be as follows: 


    Screenshot_75.png     

    From the final table, it can be concluded that the total number of cases in Levmisto is 3 on day 3.
    Thus, the correct option is C.

    671.

    On which day(s) did Pesmisto not have any new case?

    Option A is the correct answer.

    Video Explanation

    Explanatory Answer

    From statement 6, it can be concluded that the total number of new cases is equal to 12+12+5+14 = 43.


    Also, since the total number of cases in Kitmisto is 14, it can be concluded that the number of cases each day is either 2 or 3, where 3 cases are recorded on 4 days and 2 cases are recorded on 1 day.


    From statement 4, it can be concluded that the number of new cases for Pesmisto will be 0,1,1,1, and 2, in any order(Since the total number of cases is 5, and the maximum number of new cases is 2).


    In statement 3, it is given that the number of new cases kept increasing during the 5-day period.


    Now, as it is already known that the maximum number of cases for Pesmisto is 2, the maximum total number of cases in a day(or on day 5) will be less than 12.


    Let us consider the maximum number of cases on Day 5 as 10. 


    Thus the maximum number of cases possible for the remaining days will be 9, 8, 7, and 6. So, the total number of maximum cases possible for this case will be 40(less than 43).


    Thus, the number of cases on Day 5 will be 11(i.e., b/w 10 and 11)


    Now, if the number of cases on Day 4 is 9, the maximum number of cases possible for the remaining days will be 8, 7, and 6. Thus, the maximum number of cases, in this case, will be 41(less than 43).


    So, the number of cases on day 4 will be 10.


    Now, if the number of cases on Day 3 is 8, the number of cases on day 2 will be 7, and the maximum possible number of cases on Day 1 will be 6.


    Thus, the number of cases, in this case, will be 42(less than 43).


    Thus, the number of cases on day 3 will be 9, the number of cases on day 2 will be 8, and the number of cases on day 1 will be 5.


    Screenshot_74.png     


    Since all the neighbourhood has at least one case on Day 1, the only possible combination will be 1, 1, 1, and 2 for Levmisto, Tyhrmisto, Pesmisto and Kitmisto, respectively.


    Now, for the other 4 days, the number of cases in Kitmisto will be 3.


    For day 5, the number of cases will be 3, 3, 2, and 3 for Levmisto, Tyhrmisto, Pesmisto and Kitmisto, respectively(since the maximum number of cases in Pesmisto is 2).


    And since Pesmisto only has the maximum number of cases on one day, the number of cases on day 4 will be 3, 3, 1, and 3 for Levmisto, Tyhrmisto, Pesmisto and Kitmisto, respectively.


    On day 2, since Kitmisto is the only neighbourhood to have 3 cases, the number of cases on day 2 will be 2, 2, 1, and 3 for Levmisto, Tyhrmisto, Pesmisto and Kitmisto, respectively.


    Now, on day 3, the number of cases will be 3, 3, 0, and 3 for Levmisto, Tyhrmisto, Pesmisto and Kitmisto, respectively. Thus, the final table will be as follows: 


    Screenshot_75.png     


    From the final table, it can be concluded that on Day 3, the number of cases will be zero for Pesmisto. Thus, the correct option is A. 

    672.

    Which of the two statements below is/are necessarily false?
    Statement A: There were 2 new cases in Tyhrmisto on Day 3.
    Statement B: There were no new cases in Pesmisto on Day 2.

    Option B is the correct answer.

    Video Explanation

    Explanatory Answer

    From statement 6, it can be concluded that the total number of new cases is equal to 12+12+5+14 = 43.


    Also, since the total number of cases in Kitmisto is 14, it can be concluded that the number of cases each day is either 2 or 3, where 3 cases are recorded on 4 days and 2 cases are recorded on 1 day.


    From statement 4, it can be concluded that the number of new cases for Pesmisto will be 0,1,1,1, and 2, in any order(Since the total number of cases is 5, and the maximum number of new cases is 2).


    In statement 3, it is given that the number of new cases kept increasing during the 5-day period.


    Now, as it is already known that the maximum number of cases for Pesmisto is 2, the maximum total number of cases in a day(or on day 5) will be less than 12.


    Let us consider the maximum number of cases on Day 5 as 10. 


    Thus the maximum number of cases possible for the remaining days will be 9, 8, 7, and 6. So, the total number of maximum cases possible for this case will be 40(less than 43).


    Thus, the number of cases on Day 5 will be 11(i.e., b/w 10 and 11)


    Now, if the number of cases on Day 4 is 9, the maximum number of cases possible for the remaining days will be 8, 7, and 6. Thus, the maximum number of cases, in this case, will be 41(less than 43).


    So, the number of cases on day 4 will be 10.


    Now, if the number of cases on Day 3 is 8, the number of cases on day 2 will be 7, and the maximum possible number of cases on Day 1 will be 6.


    Thus, the number of cases, in this case, will be 42(less than 43).


    Thus, the number of cases on day 3 will be 9, the number of cases on day 2 will be 8, and the number of cases on day 1 will be 5.


    Screenshot_74.png     


    Since all the neighbourhood has at least one case on Day 1, the only possible combination will be 1, 1, 1, and 2 for Levmisto, Tyhrmisto, Pesmisto and Kitmisto, respectively.


    Now, for the other 4 days, the number of cases in Kitmisto will be 3.


    For day 5, the number of cases will be 3, 3, 2, and 3 for Levmisto, Tyhrmisto, Pesmisto and Kitmisto, respectively(since the maximum number of cases in Pesmisto is 2).


    And since Pesmisto only has the maximum number of cases on one day, the number of cases on day 4 will be 3, 3, 1, and 3 for Levmisto, Tyhrmisto, Pesmisto and Kitmisto, respectively.


    On day 2, since Kitmisto is the only neighbourhood to have 3 cases, the number of cases on day 2 will be 2, 2, 1, and 3 for Levmisto, Tyhrmisto, Pesmisto and Kitmisto, respectively.


    Now, on day 3, the number of cases will be 3, 3, 0, and 3 for Levmisto, Tyhrmisto, Pesmisto and Kitmisto, respectively. Thus, the final table will be as follows: 


    Screenshot_75.png     

    From the final table, it can be concluded that both statements are false. Thus the correct option is D. 


    673.

    On how many days did Levmisto and Tyhrmisto have the same number of new cases?

    Option B is the correct answer.

    Video Explanation

    Explanatory Answer

    From statement 6, it can be concluded that the total number of new cases is equal to 12+12+5+14 = 43.


    Also, since the total number of cases in Kitmisto is 14, it can be concluded that the number of cases each day is either 2 or 3, where 3 cases are recorded on 4 days and 2 cases are recorded on 1 day.


    From statement 4, it can be concluded that the number of new cases for Pesmisto will be 0,1,1,1, and 2, in any order(Since the total number of cases is 5, and the maximum number of new cases is 2).


    In statement 3, it is given that the number of new cases kept increasing during the 5-day period.


    Now, as it is already known that the maximum number of cases for Pesmisto is 2, the maximum total number of cases in a day(or on day 5) will be less than 12.


    Let us consider the maximum number of cases on Day 5 as 10. 


    Thus the maximum number of cases possible for the remaining days will be 9, 8, 7, and 6. So, the total number of maximum cases possible for this case will be 40(less than 43).


    Thus, the number of cases on Day 5 will be 11(i.e., b/w 10 and 11)


    Now, if the number of cases on Day 4 is 9, the maximum number of cases possible for the remaining days will be 8, 7, and 6. Thus, the maximum number of cases, in this case, will be 41(less than 43).


    So, the number of cases on day 4 will be 10.


    Now, if the number of cases on Day 3 is 8, the number of cases on day 2 will be 7, and the maximum possible number of cases on Day 1 will be 6.


    Thus, the number of cases, in this case, will be 42(less than 43).


    Thus, the number of cases on day 3 will be 9, the number of cases on day 2 will be 8, and the number of cases on day 1 will be 5.


    Screenshot_74.png     


    Since all the neighbourhood has at least one case on Day 1, the only possible combination will be 1, 1, 1, and 2 for Levmisto, Tyhrmisto, Pesmisto and Kitmisto, respectively.


    Now, for the other 4 days, the number of cases in Kitmisto will be 3.


    For day 5, the number of cases will be 3, 3, 2, and 3 for Levmisto, Tyhrmisto, Pesmisto and Kitmisto, respectively(since the maximum number of cases in Pesmisto is 2).


    And since Pesmisto only has the maximum number of cases on one day, the number of cases on day 4 will be 3, 3, 1, and 3 for Levmisto, Tyhrmisto, Pesmisto and Kitmisto, respectively.


    On day 2, since Kitmisto is the only neighbourhood to have 3 cases, the number of cases on day 2 will be 2, 2, 1, and 3 for Levmisto, Tyhrmisto, Pesmisto and Kitmisto, respectively.


    Now, on day 3, the number of cases will be 3, 3, 0, and 3 for Levmisto, Tyhrmisto, Pesmisto and Kitmisto, respectively. Thus, the final table will be as follows: 


    Screenshot_75.png     


    It can be concluded from the final table that the number of cases will be the same for all the days.
    Thus, the correct option is D

    674.

    Read the following information carefully, analyze it, and answer the question based on it. 

    In the following, a year corresponds to 1st of January of that year.

    A study to determine the mortality rate for a disease began in 1980. The study chose 1000 males and 1000 females and followed them for forty years or until they died, whichever came first. The 1000 males chosen in 1980 consisted of 250 each of ages 10 to less than 20, 20 to less than 30, 30 to less than 40, and 40 to less than 50. The 1000 females chosen in 1980 also consisted of 250 each of ages 10 to less than 20, 20 to less than 30, 30 to less than 40, and 40 to less than 50.

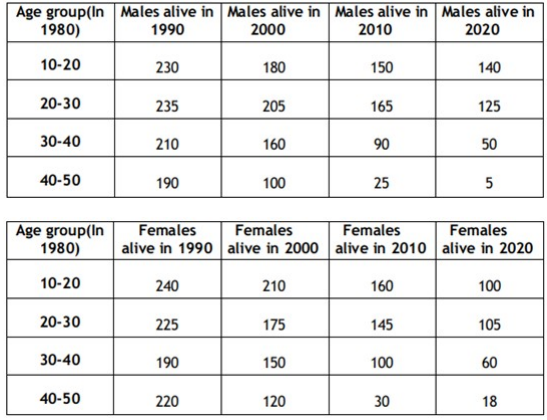
    The four figures below depict the age profile of those among the 2000 individuals who were still alive in 1990, 2000, 2010, and 2020. The blue bars in each figure represent the number of males in each age group at that point in time, while the pink bars represent the number of females in each age group at that point in time. The numbers next to the bars give the exact numbers being represented by the bars. For example, we know that 230 males among those tracked and who were alive in 1990 were aged between 20 and 30.

    651.

    How many individuals who were being tracked and who were less than 30 years of age in 1980 survived until 2020?

    Option A is the correct answer.

    Video Explanation

    Explanatory Answer

    The total number of male and female test cases in 1980 = 1000 


    Screenshot_73.png     


    The total number of males alive in 2000 = 180 + 205 + 160 + 100 = 645 Thus, the number of dead males in 2000 = 1000 - 645 = 355

    Similarly, the total number of dead females in 2000 = 1000 - (210 + 175 + 150 + 120) = 1000 - 655 = 345

    Thus, the required ratio = 355 : 345 = 71 : 69. Thus, the correct option is A. 

    652.

    How many of the males who were being tracked and who were between 20 and 30 years of age in 1980 died in the period 2000 to 2010?

    Answer : 40

    Video Explanation

    Explanatory Answer

    The total number of male and female test cases in 1980 = 1000 


    Screenshot_73.png     


    The total number of males between 20 and 30 years of age in 1980 who died in 2000 = 205 The total number of males between 20 and 30 years of age in 1980 who died in 2010 = 165

    Thus, the total number of males between 20 and 30 years of age in 1980 who died in the period 2000 to 2010 = 205 - 165 = 40

    Hence, 40 

    653.

    How many of the females who were being tracked and who were between 20 and 30 years of age in 1980 died between the ages of 50 and 60?

    Answer : 30

    Video Explanation

    Explanatory Answer

    The total number of male and female test cases in 1980 = 1000 


    Screenshot_73.png     


    We are given that there are 250 females from age 20-30 in 1980 and in 2000 these females age are from 40-50 but only 175 are alive in 2000.


    In 2000 there were 175 females from age 40-50. If we assume that out of these, 30 females were of age 48 years in 2000 and they died in 2005, then there are 30 females who died at the age of 53.


    If we assume that out of the 175 females, 30 females were of age 42 years in 2000, and they died in 2005, then 30 females died at the age of 47. Now, if we assume that there are 15 females of age 42 and 15 females of age 48 in the year 2000, and they all died in 2005, then we have 15 females who died at the age of 47 and 15 females who died at the age of 53.


    So we can see that there are many cases possible. We are given that there were 250 females aged 20-30 in 1980, and in 2010, these females ages are from 50-60, but only 145 are alive in 2010.


    In 2010 there were 145 females from age 50-60. If we assume that out of these, 40 females were of age 58 years in 2010 and they died in 2015, then there are 40 females who died at the age of 63.


    If we assume that out of the 145 females, 40 females are of age 52 years age in 2010, and they died in 2015, then 40 females died at the age of 57. Now, if we assume that there are 15 females of age 52 and 25 females of age 58 in the year 2010, and they all died in 2015, then we have 15 females who died at the age of 57 and 25 females who died at the age of 63.


    So we can see that again, there are many cases possible. In the first case, the range of values possible is from 0 to 30. In the second case, the range of values possible is from 0 to 40. So in total, we get a range of possible values from 0 to 70.


    Thus, only one possible value of this question is not possible.


    Hence, 30 

    675.

    How many individuals who were being tracked and who were less than 30 years of age in 1980 survived until 2020?

    Option A is the correct answer.

    Video Explanation

    Explanatory Answer

    The total number of male and female test cases in 1980 = 1000 


    Screenshot_73.png     


    The total number of males alive in 2000 = 180 + 205 + 160 + 100 = 645 Thus, the number of dead males in 2000 = 1000 - 645 = 355

    Similarly, the total number of dead females in 2000 = 1000 - (210 + 175 + 150 + 120) = 1000 - 655 = 345

    Thus, the required ratio = 355 : 345 = 71 : 69. Thus, the correct option is A. 

    676.

    How many of the males who were being tracked and who were between 20 and 30 years of age in 1980 died in the period 2000 to 2010?

    Answer : 40

    Video Explanation

    Explanatory Answer

    The total number of male and female test cases in 1980 = 1000 


    Screenshot_73.png     


    The total number of males between 20 and 30 years of age in 1980 who died in 2000 = 205 The total number of males between 20 and 30 years of age in 1980 who died in 2010 = 165

    Thus, the total number of males between 20 and 30 years of age in 1980 who died in the period 2000 to 2010 = 205 - 165 = 40

    Hence, 40 

    677.

    How many of the females who were being tracked and who were between 20 and 30 years of age in 1980 died between the ages of 50 and 60?

    Answer : 30

    Video Explanation

    Explanatory Answer

    The total number of male and female test cases in 1980 = 1000 


    Screenshot_73.png     


    We are given that there are 250 females from age 20-30 in 1980 and in 2000 these females age are from 40-50 but only 175 are alive in 2000.


    In 2000 there were 175 females from age 40-50. If we assume that out of these, 30 females were of age 48 years in 2000 and they died in 2005, then there are 30 females who died at the age of 53.


    If we assume that out of the 175 females, 30 females were of age 42 years in 2000, and they died in 2005, then 30 females died at the age of 47. Now, if we assume that there are 15 females of age 42 and 15 females of age 48 in the year 2000, and they all died in 2005, then we have 15 females who died at the age of 47 and 15 females who died at the age of 53.


    So we can see that there are many cases possible. We are given that there were 250 females aged 20-30 in 1980, and in 2010, these females ages are from 50-60, but only 145 are alive in 2010.


    In 2010 there were 145 females from age 50-60. If we assume that out of these, 40 females were of age 58 years in 2010 and they died in 2015, then there are 40 females who died at the age of 63.


    If we assume that out of the 145 females, 40 females are of age 52 years age in 2010, and they died in 2015, then 40 females died at the age of 57. Now, if we assume that there are 15 females of age 52 and 25 females of age 58 in the year 2010, and they all died in 2015, then we have 15 females who died at the age of 57 and 25 females who died at the age of 63.


    So we can see that again, there are many cases possible. In the first case, the range of values possible is from 0 to 30. In the second case, the range of values possible is from 0 to 40. So in total, we get a range of possible values from 0 to 70.


    Thus, only one possible value of this question is not possible.


    Hence, 30 

    678.

    Which of the following pairings was made in Round 5?

    Option C is the correct answer.

    Video Explanation

    Explanatory Answer

    Screenshot_53.png


    Screenshot_54.png


    Screenshot_55.png


    Screenshot_56.png


    Screenshot_57.png


    Screenshot_58.png


    Screenshot_59.png


    Screenshot_60.png


    Screenshot_62.png


    Screenshot_63.png


    Screenshot_64.png


    Screenshot_65.png


    Screenshot_66.png


    Screenshot_67.png


    Screenshot_68.png


    679.

    In 2000, what was the ratio of the number of dead males to dead females among those being tracked?

    Option C is the correct answer.

    Video Explanation

    Explanatory Answer

    Screenshot_53.png


    Screenshot_54.png


    Screenshot_55.png


    Screenshot_56.png


    Screenshot_57.png


    Screenshot_58.png


    Screenshot_59.png


    Screenshot_60.png


    Screenshot_62.png


    Screenshot_63.png


    Screenshot_64.png


    Screenshot_65.png


    Screenshot_66.png


    Screenshot_67.png


    Screenshot_68.png


    680.

    How many people who were being tracked and who were between 30 and 40 years of age in 1980 survived until 2010?

    Option B is the correct answer.

    Video Explanation

    Explanatory Answer

    Screenshot_53.png


    Screenshot_54.png


    Screenshot_55.png


    Screenshot_56.png


    Screenshot_57.png


    Screenshot_58.png


    Screenshot_59.png


    Screenshot_60.png


    Screenshot_62.png


    Screenshot_63.png


    Screenshot_64.png


    Screenshot_65.png


    Screenshot_66.png


    Screenshot_67.png


    Screenshot_68.png


    681.

    What BEST can be said about the amount of money that Pulak had with him at the end of Round 6?

    Option A is the correct answer.

    Video Explanation

    Explanatory Answer

    Screenshot_53.png


    Screenshot_54.png


    Screenshot_55.png


    Screenshot_56.png


    Screenshot_57.png


    Screenshot_58.png


    Screenshot_59.png


    Screenshot_60.png


    Screenshot_62.png


    Screenshot_63.png


    Screenshot_64.png


    Screenshot_65.png


    Screenshot_66.png


    Screenshot_67.png


    Screenshot_68.png


    682.

    How much money (in ₹) did Ritesh have at the end of Round 4?

    Answer : 6

    Video Explanation

    Explanatory Answer

    Screenshot_53.png


    Screenshot_54.png


    Screenshot_55.png


    Screenshot_56.png


    Screenshot_57.png


    Screenshot_58.png


    Screenshot_59.png


    Screenshot_60.png


    Screenshot_62.png


    Screenshot_63.png


    Screenshot_64.png


    Screenshot_65.png


    Screenshot_66.png


    Screenshot_67.png


    Screenshot_68.png


    683.

    How many games were played with a bet of ₹2?

    Answer : 6

    Video Explanation

    Explanatory Answer

    Screenshot_53.png


    Screenshot_54.png


    Screenshot_55.png


    Screenshot_56.png


    Screenshot_57.png


    Screenshot_58.png


    Screenshot_59.png


    Screenshot_60.png


    Screenshot_62.png


    Screenshot_63.png


    Screenshot_64.png


    Screenshot_65.png


    Screenshot_66.png


    Screenshot_67.png


    Screenshot_68.png


    684.

    What BEST can be said about the amount of money that Ritesh had with him at the end of Round 8?

    Option A is the correct answer.

    Video Explanation

    Explanatory Answer

    Screenshot_53.png


    Screenshot_54.png


    Screenshot_55.png


    Screenshot_56.png


    Screenshot_57.png


    Screenshot_58.png


    Screenshot_59.png


    Screenshot_60.png


    Screenshot_62.png


    Screenshot_63.png


    Screenshot_64.png


    Screenshot_65.png


    Screenshot_66.png


    Screenshot_67.png


    Screenshot_68.png


    685.

    Read the following information carefully, analyze it, and answer the question based on it. 


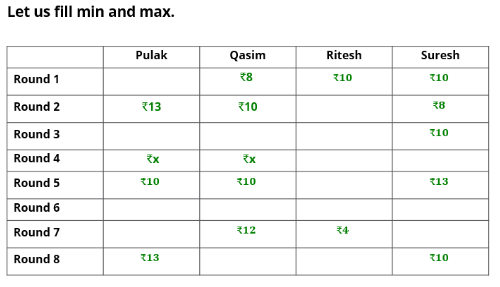
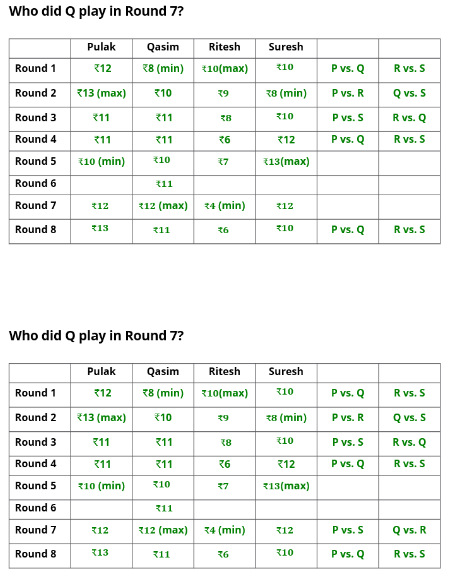
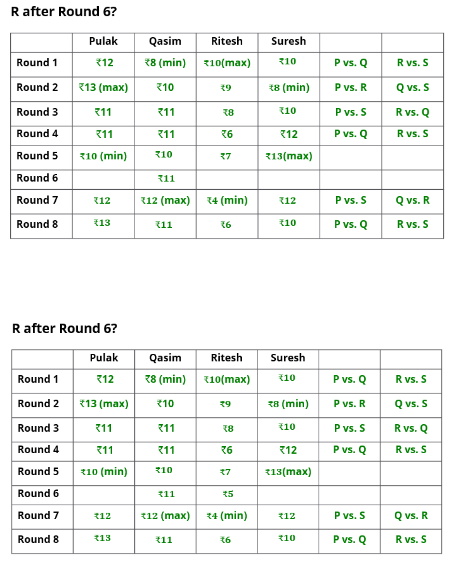
    Pulak, Qasim, Ritesh, and Suresh participated in a tournament comprising of eight rounds. In each round, they formed two pairs, with each of them being in exactly one pair. The only restriction in the pairing was that the pairs would change in successive rounds. For example, if Pulak formed a pair with Qasim in the first round, then he would have to form a pair with Ritesh or Suresh in the second round. He would be free to pair with Qasim again in the third round. In each round, each pair decided whether to play the game in that round or not. If they decided not to play, then no money was exchanged between them. If they decided to play, they had to bet either ₹1 or ₹2 in that round. For example, if they chose to bet ₹2, then the player winning the game got ₹2 from the one losing the game.


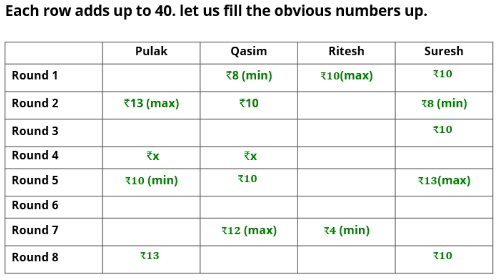
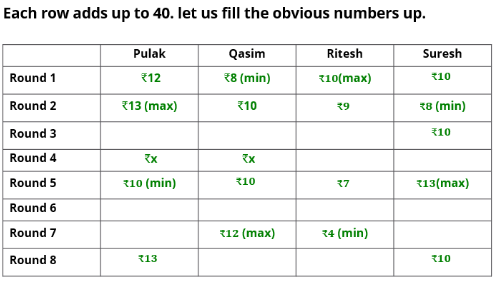
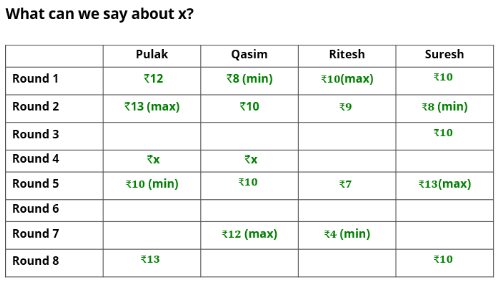
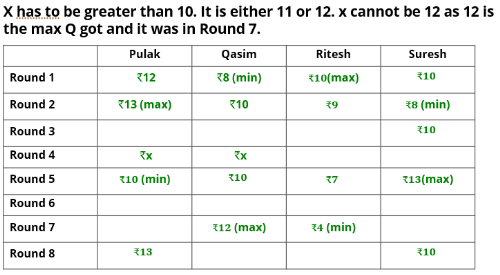
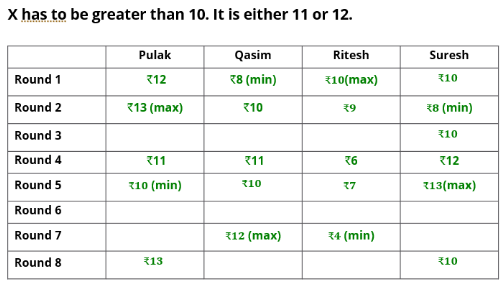
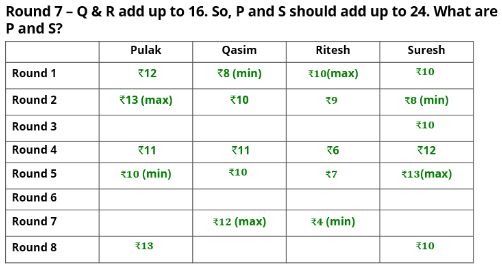
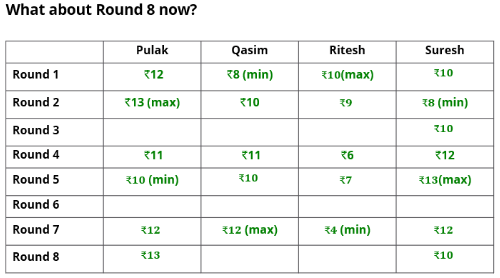
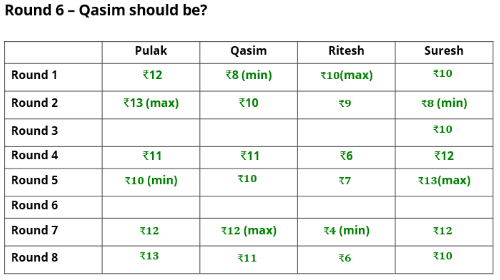
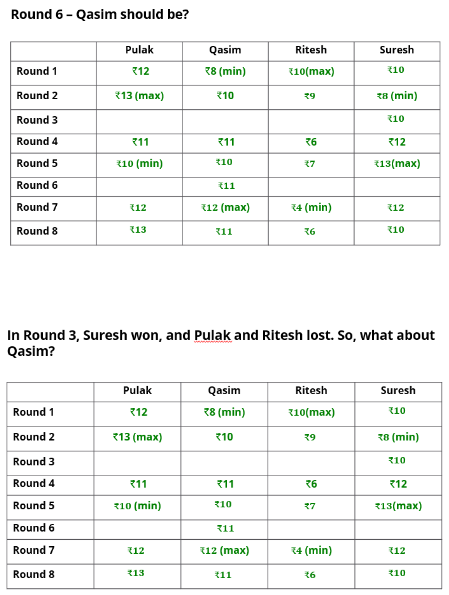
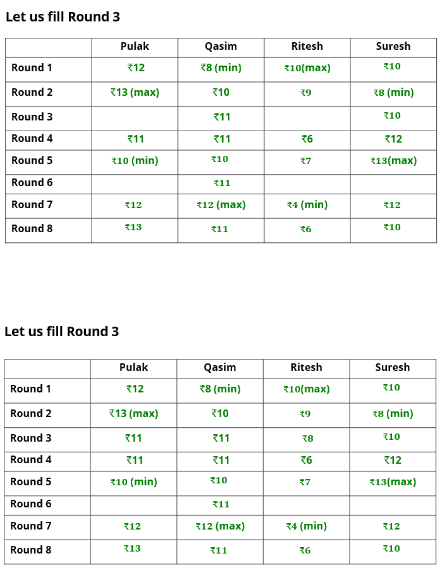
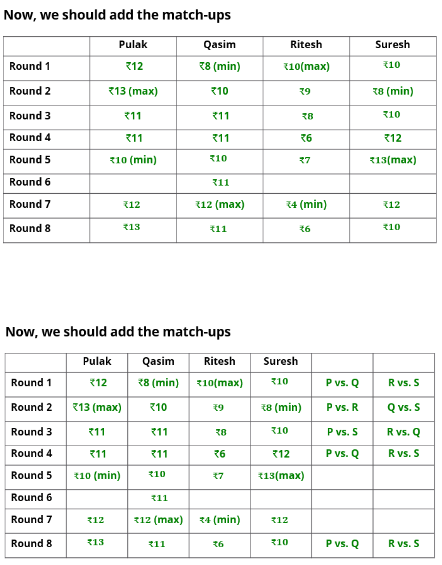
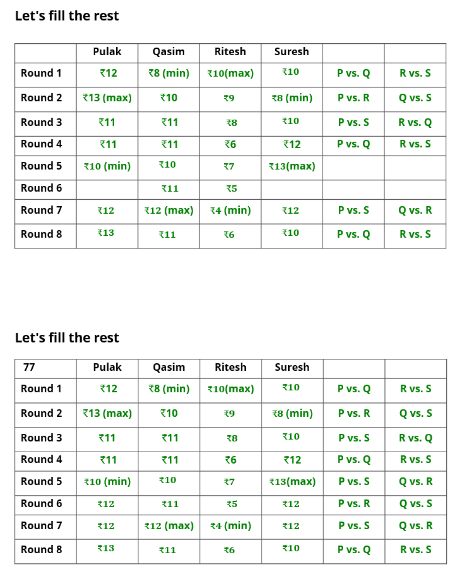
    At the beginning of the tournament, the players had ₹10 each. The following table shows partial information about the amounts that the players had at the end of each of the eight rounds. It shows every time a player had ₹10 at the end of a round, as well as every time, at the end of a round, a player had either the minimum or the maximum amount that he would have had across the eight rounds. For example, Suresh had ₹10 at the end of Rounds 1, 3, and 8 and not after any of the other rounds. The maximum amount that he had at the end of any round was ₹13 (at the end of Round 5), and the minimum amount he had at the end of any round was ₹8 (at the end of Round 2). At the end of all other rounds, he must have had either ₹9, ₹11, or ₹12.


    It was also known that Pulak and Qasim had the same amount of money with them at the end of Round 4.
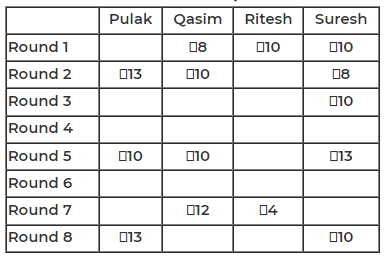
     

    Screenshot_52.png

    651.

    What BEST can be said about the amount of money that Ritesh had with him at the end of Round 8?

    Option A is the correct answer.

    Video Explanation

    Explanatory Answer

    Screenshot_53.png


    Screenshot_54.png


    Screenshot_55.png


    Screenshot_56.png


    Screenshot_57.png


    Screenshot_58.png


    Screenshot_59.png


    Screenshot_60.png


    Screenshot_62.png


    Screenshot_63.png


    Screenshot_64.png


    Screenshot_65.png


    Screenshot_66.png


    Screenshot_67.png


    Screenshot_68.png


    652.

    What BEST can be said about the amount of money that Pulak had with him at the end of Round 6?

    Option A is the correct answer.

    Video Explanation

    Explanatory Answer

    Screenshot_53.png


    Screenshot_54.png


    Screenshot_55.png


    Screenshot_56.png


    Screenshot_57.png


    Screenshot_58.png


    Screenshot_59.png


    Screenshot_60.png


    Screenshot_62.png


    Screenshot_63.png


    Screenshot_64.png


    Screenshot_65.png


    Screenshot_66.png


    Screenshot_67.png


    Screenshot_68.png


    653.

    How much money (in ₹) did Ritesh have at the end of Round 4?

    Answer : 6

    Video Explanation

    Explanatory Answer

    Screenshot_53.png


    Screenshot_54.png


    Screenshot_55.png


    Screenshot_56.png


    Screenshot_57.png


    Screenshot_58.png


    Screenshot_59.png


    Screenshot_60.png


    Screenshot_62.png


    Screenshot_63.png


    Screenshot_64.png


    Screenshot_65.png


    Screenshot_66.png


    Screenshot_67.png


    Screenshot_68.png


    654.

    How many games were played with a bet of ₹2?

    Answer : 6

    Video Explanation

    Explanatory Answer

    Screenshot_53.png


    Screenshot_54.png


    Screenshot_55.png


    Screenshot_56.png


    Screenshot_57.png


    Screenshot_58.png


    Screenshot_59.png


    Screenshot_60.png


    Screenshot_62.png


    Screenshot_63.png


    Screenshot_64.png


    Screenshot_65.png


    Screenshot_66.png


    Screenshot_67.png


    Screenshot_68.png


    655.

    Which of the following pairings was made in Round 5?

    Option C is the correct answer.

    Video Explanation

    Explanatory Answer

    Screenshot_53.png


    Screenshot_54.png


    Screenshot_55.png


    Screenshot_56.png


    Screenshot_57.png


    Screenshot_58.png


    Screenshot_59.png


    Screenshot_60.png


    Screenshot_62.png


    Screenshot_63.png


    Screenshot_64.png


    Screenshot_65.png


    Screenshot_66.png


    Screenshot_67.png


    Screenshot_68.png


    656.

    In 2000, what was the ratio of the number of dead males to dead females among those being tracked?

    Option C is the correct answer.

    Video Explanation

    Explanatory Answer

    Screenshot_53.png


    Screenshot_54.png


    Screenshot_55.png


    Screenshot_56.png


    Screenshot_57.png


    Screenshot_58.png


    Screenshot_59.png


    Screenshot_60.png


    Screenshot_62.png


    Screenshot_63.png


    Screenshot_64.png


    Screenshot_65.png


    Screenshot_66.png


    Screenshot_67.png


    Screenshot_68.png


    657.

    How many people who were being tracked and who were between 30 and 40 years of age in 1980 survived until 2010?

    Option B is the correct answer.

    Video Explanation

    Explanatory Answer

    Screenshot_53.png


    Screenshot_54.png


    Screenshot_55.png


    Screenshot_56.png


    Screenshot_57.png


    Screenshot_58.png


    Screenshot_59.png


    Screenshot_60.png


    Screenshot_62.png


    Screenshot_63.png


    Screenshot_64.png


    Screenshot_65.png


    Screenshot_66.png


    Screenshot_67.png


    Screenshot_68.png


    686.

    Read the following information carefully, analyze it, and answer the question based on it. 


    All the first-year students in the computer science (CS) department in a university take both the courses (i) AI and (ii) ML. Students from other departments (non-CS students) can also take one of these two courses, but not both. Students who fail in a course get an F grade; others pass and are awarded A or B or C grades depending on their performance. The following are some additional facts about the number of students who took these two courses this year and the grades they obtained.

    1. The numbers of non-CS students who took AI and ML were in the ratio 2 : 5.
    2. The number of non-CS students who took either AI or ML was equal to the number of CS students.
    3. The numbers of non-CS students who failed in the two courses were the same and their total is equal to the number of CS students who got a C grade in ML.
    4. In both the courses, 50% of the students who passed got a B grade. But, while the numbers of students who got A and C grades were the same for AI, they were in the ratio 3 : 2 for ML.
    5. No CS student failed in AI, while no non-CS student got an A grade in AI.
    6. The numbers of CS students who got A, B and C grades respectively in AI were in the ratio 3 : 5 : 2, while in ML the ratio was 4 : 5 : 2.
    7. The ratio of the total number of non-CS students failing in one of the two courses to the number of CS students failing in one of the two courses was 3 : 1.
    8. 30 students failed in ML.

    651.

    How many students took AI?

    Option B is the correct answer.

    Video Explanation

    Explanatory Answer

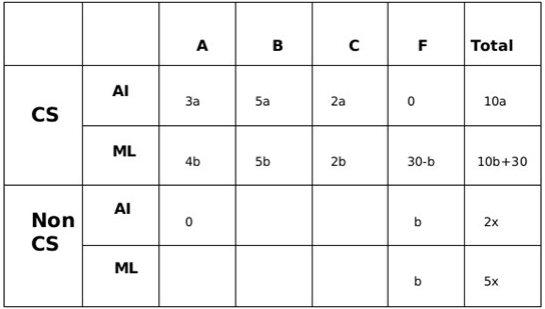
    The numbers of CS students who got A, B and C grades respectively in AI were in t
    he ratio 3a, 5a and 2a, while in ML the ratio was 4b, 5b and 2b.

    From statement 3 we can say that the number of non- CS students who failed in AI and ML are b i
    n each category. Now from statement 8, we can say that number of CS students who failed in MI i
    s equal to 30-b. 


    Screenshot_69.png


    2 b 3

    From statement 7, we can say that, 30− b = 1

    or, 2b = 90-3b or, b= 18
    CS students take both the AI and ML courses, therefore 10a= 10b +30 or, a= b+3 = 21

    From statement 2, we can say that 10a = 7x or, x = 30 

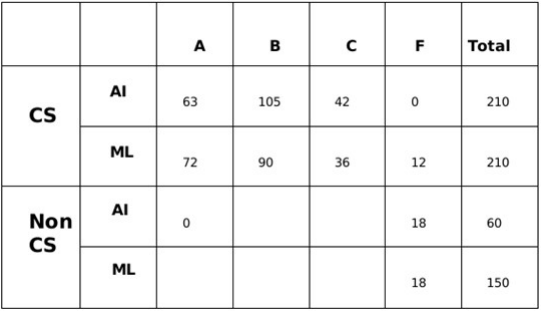
    Substituting the values of a, b and x in the above table. 


    Screenshot_71.png


    A total of 270 students took AI out of which 252 students passed and a total of 360 students took
    ML out of which 330 students passed.

    From statement 4, we can say that out of the 252 students who passed in AI, 126 of them got Gra
    de B and 63 got Grade A and 63 got Grade C.

    Similarly, We can say that out of the 330 students who passed in ML, 165 of them got Grade C and
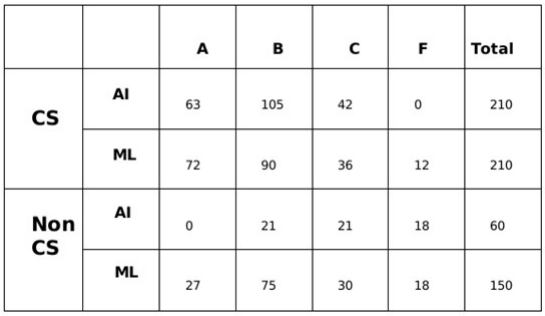
    99 got Grade A and 66 got Grade C. Therefore, the final table which we get is


    Screenshot_70.png 

    652.

    How many CS students failed in ML?

    Answer : 12

    Video Explanation

    Explanatory Answer

    The numbers of CS students who got A, B and C grades respectively in AI were in t
    he ratio 3a, 5a and 2a, while in ML the ratio was 4b, 5b and 2b.

    From statement 3 we can say that the number of non- CS students who failed in AI and ML are b i
    n each category. Now from statement 8, we can say that number of CS students who failed in MI i
    s equal to 30-b. 


    Screenshot_69.png


    2 b 3

    From statement 7, we can say that, 30− b = 1

    or, 2b = 90-3b or, b= 18
    CS students take both the AI and ML courses, therefore 10a= 10b +30 or, a= b+3 = 21

    From statement 2, we can say that 10a = 7x or, x = 30 

    Substituting the values of a, b and x in the above table. 


    Screenshot_71.png


    A total of 270 students took AI out of which 252 students passed and a total of 360 students took
    ML out of which 330 students passed.

    From statement 4, we can say that out of the 252 students who passed in AI, 126 of them got Gra
    de B and 63 got Grade A and 63 got Grade C.

    Similarly, We can say that out of the 330 students who passed in ML, 165 of them got Grade C and
    99 got Grade A and 66 got Grade C. Therefore, the final table which we get is


    Screenshot_70.png 

    653.

    How many non-CS students got A grade in ML?

    Answer : 27

    Video Explanation

    Explanatory Answer

    The numbers of CS students who got A, B and C grades respectively in AI were in t
    he ratio 3a, 5a and 2a, while in ML the ratio was 4b, 5b and 2b.

    From statement 3 we can say that the number of non- CS students who failed in AI and ML are b i
    n each category. Now from statement 8, we can say that number of CS students who failed in MI i
    s equal to 30-b. 


    Screenshot_69.png


    2 b 3

    From statement 7, we can say that, 30− b = 1

    or, 2b = 90-3b or, b= 18

    CS students take both the AI and ML courses, therefore 10a= 10b +30 or, a= b+3 = 21

    From statement 2, we can say that 10a = 7x or, x = 30 

    Substituting the values of a, b and x in the above table. 


    Screenshot_71.png


    A total of 270 students took AI out of which 252 students passed and a total of 360 students took
    ML out of which 330 students passed.

    From statement 4, we can say that out of the 252 students who passed in AI, 126 of them got Gra
    de B and 63 got Grade A and 63 got Grade C.

    Similarly, We can say that out of the 330 students who passed in ML, 165 of them got Grade C and
    99 got Grade A and 66 got Grade C. Therefore, the final table which we get is


    Screenshot_70.png 

    654.

    How many students got A grade in AI?

    Option D is the correct answer.

    Video Explanation

    Explanatory Answer

    The numbers of CS students who got A, B and C grades respectively in AI were in t
    he ratio 3a, 5a and 2a, while in ML the ratio was 4b, 5b and 2b.

    From statement 3 we can say that the number of non- CS students who failed in AI and ML are b i
    n each category. Now from statement 8, we can say that number of CS students who failed in MI i
    s equal to 30-b. 


    Screenshot_69.png


    2 b 3

    From statement 7, we can say that, 30− b = 1

    or, 2b = 90-3b or, b= 18

    CS students take both the AI and ML courses, therefore 10a= 10b +30 or, a= b+3 = 21

    From statement 2, we can say that 10a = 7x or, x = 30 

    Substituting the values of a, b and x in the above table. 


    Screenshot_71.png


    A total of 270 students took AI out of which 252 students passed and a total of 360 students took
    ML out of which 330 students passed.

    From statement 4, we can say that out of the 252 students who passed in AI, 126 of them got Gra
    de B and 63 got Grade A and 63 got Grade C.

    Similarly, We can say that out of the 330 students who passed in ML, 165 of them got Grade C and
    99 got Grade A and 66 got Grade C. Therefore, the final table which we get is


    Screenshot_70.png 

    655.

    How many non-CS students got B grade in ML?

    Option D is the correct answer.

    Video Explanation

    Explanatory Answer

    The numbers of CS students who got A, B and C grades respectively in AI were in t
    he ratio 3a, 5a and 2a, while in ML the ratio was 4b, 5b and 2b.

    From statement 3 we can say that the number of non- CS students who failed in AI and ML are b i
    n each category. Now from statement 8, we can say that number of CS students who failed in MI i
    s equal to 30-b. 


    Screenshot_69.png


    2 b 3

    From statement 7, we can say that, 30− b = 1

    or, 2b = 90-3b or, b= 18

    CS students take both the AI and ML courses, therefore 10a= 10b +30 or, a= b+3 = 21

    From statement 2, we can say that 10a = 7x or, x = 30 

    Substituting the values of a, b and x in the above table. 


    Screenshot_71.png


    A total of 270 students took AI out of which 252 students passed and a total of 360 students took
    ML out of which 330 students passed.

    From statement 4, we can say that out of the 252 students who passed in AI, 126 of them got Gra
    de B and 63 got Grade A and 63 got Grade C.

    Similarly, We can say that out of the 330 students who passed in ML, 165 of them got Grade C and
    99 got Grade A and 66 got Grade C. Therefore, the final table which we get is


    Screenshot_70.png 

    687.

    How many students took AI?

    Option B is the correct answer.

    Video Explanation

    Explanatory Answer

    The numbers of CS students who got A, B and C grades respectively in AI were in t
    he ratio 3a, 5a and 2a, while in ML the ratio was 4b, 5b and 2b.

    From statement 3 we can say that the number of non- CS students who failed in AI and ML are b i
    n each category. Now from statement 8, we can say that number of CS students who failed in MI i
    s equal to 30-b. 


    Screenshot_69.png


    2 b 3

    From statement 7, we can say that, 30− b = 1

    or, 2b = 90-3b or, b= 18

    CS students take both the AI and ML courses, therefore 10a= 10b +30 or, a= b+3 = 21

    From statement 2, we can say that 10a = 7x or, x = 30 

    Substituting the values of a, b and x in the above table. 


    Screenshot_71.png


    A total of 270 students took AI out of which 252 students passed and a total of 360 students took
    ML out of which 330 students passed.

    From statement 4, we can say that out of the 252 students who passed in AI, 126 of them got Gra
    de B and 63 got Grade A and 63 got Grade C.

    Similarly, We can say that out of the 330 students who passed in ML, 165 of them got Grade C and
    99 got Grade A and 66 got Grade C. Therefore, the final table which we get is


    Screenshot_70.png 

    688.

    How many CS students failed in ML?

    Answer : 12

    Video Explanation

    Explanatory Answer

    The numbers of CS students who got A, B and C grades respectively in AI were in t
    he ratio 3a, 5a and 2a, while in ML the ratio was 4b, 5b and 2b.

    From statement 3 we can say that the number of non- CS students who failed in AI and ML are b i
    n each category. Now from statement 8, we can say that number of CS students who failed in MI i
    s equal to 30-b. 


    Screenshot_69.png


    2 b 3

    From statement 7, we can say that, 30− b = 1

    or, 2b = 90-3b or, b= 18

    CS students take both the AI and ML courses, therefore 10a= 10b +30 or, a= b+3 = 21

    From statement 2, we can say that 10a = 7x or, x = 30 

    Substituting the values of a, b and x in the above table. 


    Screenshot_71.png


    A total of 270 students took AI out of which 252 students passed and a total of 360 students took
    ML out of which 330 students passed.

    From statement 4, we can say that out of the 252 students who passed in AI, 126 of them got Gra
    de B and 63 got Grade A and 63 got Grade C.

    Similarly, We can say that out of the 330 students who passed in ML, 165 of them got Grade C and
    99 got Grade A and 66 got Grade C. Therefore, the final table which we get is


    Screenshot_70.png 

    689.

    How many non-CS students got A grade in ML?

    Answer : 27

    Video Explanation

    Explanatory Answer

    The numbers of CS students who got A, B and C grades respectively in AI were in t
    he ratio 3a, 5a and 2a, while in ML the ratio was 4b, 5b and 2b.

    From statement 3 we can say that the number of non- CS students who failed in AI and ML are b i
    n each category. Now from statement 8, we can say that number of CS students who failed in MI i
    s equal to 30-b. 


    Screenshot_69.png


    2 b 3

    From statement 7, we can say that, 30− b = 1

    or, 2b = 90-3b or, b= 18

    CS students take both the AI and ML courses, therefore 10a= 10b +30 or, a= b+3 = 21

    From statement 2, we can say that 10a = 7x or, x = 30 

    Substituting the values of a, b and x in the above table. 


    Screenshot_71.png


    A total of 270 students took AI out of which 252 students passed and a total of 360 students took
    ML out of which 330 students passed.

    From statement 4, we can say that out of the 252 students who passed in AI, 126 of them got Gra
    de B and 63 got Grade A and 63 got Grade C.

    Similarly, We can say that out of the 330 students who passed in ML, 165 of them got Grade C and
    99 got Grade A and 66 got Grade C. Therefore, the final table which we get is


    Screenshot_70.png 

    690.

    How many students got A grade in AI?

    Option D is the correct answer.

    Video Explanation

    Explanatory Answer

    The numbers of CS students who got A, B and C grades respectively in AI were in t
    he ratio 3a, 5a and 2a, while in ML the ratio was 4b, 5b and 2b.

    From statement 3 we can say that the number of non- CS students who failed in AI and ML are b i
    n each category. Now from statement 8, we can say that number of CS students who failed in MI i
    s equal to 30-b. 


    Screenshot_69.png


    2 b 3

    From statement 7, we can say that, 30− b = 1

    or, 2b = 90-3b or, b= 18

    CS students take both the AI and ML courses, therefore 10a= 10b +30 or, a= b+3 = 21

    From statement 2, we can say that 10a = 7x or, x = 30 

    Substituting the values of a, b and x in the above table. 


    Screenshot_71.png


    A total of 270 students took AI out of which 252 students passed and a total of 360 students took
    ML out of which 330 students passed.

    From statement 4, we can say that out of the 252 students who passed in AI, 126 of them got Gra
    de B and 63 got Grade A and 63 got Grade C.

    Similarly, We can say that out of the 330 students who passed in ML, 165 of them got Grade C and
    99 got Grade A and 66 got Grade C. Therefore, the final table which we get is


    Screenshot_70.png 

    691.

    How many non-CS students got B grade in ML?

    Option D is the correct answer.

    Video Explanation

    Explanatory Answer

    The numbers of CS students who got A, B and C grades respectively in AI were in t
    he ratio 3a, 5a and 2a, while in ML the ratio was 4b, 5b and 2b.

    From statement 3 we can say that the number of non- CS students who failed in AI and ML are b i
    n each category. Now from statement 8, we can say that number of CS students who failed in MI i
    s equal to 30-b. 


    Screenshot_69.png


    2 b 3

    From statement 7, we can say that, 30− b = 1

    or, 2b = 90-3b or, b= 18

    CS students take both the AI and ML courses, therefore 10a= 10b +30 or, a= b+3 = 21

    From statement 2, we can say that 10a = 7x or, x = 30 

    Substituting the values of a, b and x in the above table. 


    Screenshot_71.png


    A total of 270 students took AI out of which 252 students passed and a total of 360 students took
    ML out of which 330 students passed.

    From statement 4, we can say that out of the 252 students who passed in AI, 126 of them got Gra
    de B and 63 got Grade A and 63 got Grade C.

    Similarly, We can say that out of the 330 students who passed in ML, 165 of them got Grade C and
    99 got Grade A and 66 got Grade C. Therefore, the final table which we get is


    Screenshot_70.png 

    692.

    Read the following information carefully, analyze it, and answer the question based on it. 


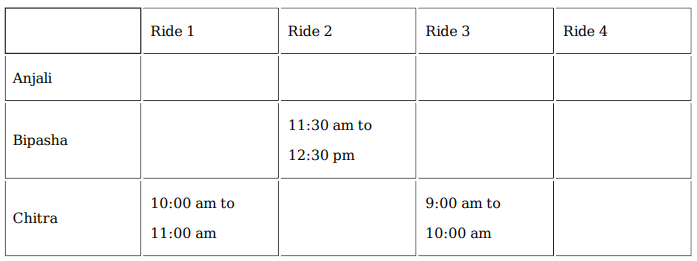
    Anjali, Bipasha, and Chitra visited an entertainment park that has four rides. Each ride lasts one hour and can accommodate one visitor at one point. All rides begin at 9 am and must be completed by 5 pm except for Ride-3, for which the last ride has to be completed by 1 pm. Ride gates open every 30 minutes, e.g. 10 am, 10:30 am, and so on. Whenever a ride gate opens, and there is no visitor inside, the first visitor waiting in the queue buys the ticket just before taking the ride. The ticket prices are Rs. 20, Rs. 50, Rs. 30 and Rs. 40 for Rides 1 to 4, respectively. Each of the three visitors took at least one ride and did not necessarily take all rides. None of them took the same ride more than once. The movement time from one ride to another is negligible, and a visitor leaves the ride immediately after the completion of the ride. No one takes a break inside the park unless mentioned explicitly.

    The following information is also known.

    1. Chitra never waited in the queue and completed her visit by 11 am after spending Rs. 50 to pay for the ticket(s).
    2. Anjali took Ride-1 at 11 am after waiting for 30 mins for Chitra to complete it. It was the only ride where Anjali waited.
    3. Bipasha began her first of three rides at 11:30 am. All three visitors incurred the same amount of ticket expense by 12:15 pm.
    4. The last ride taken by Anjali and Bipasha was the same, where Bipasha waited 30 mins for Anjali to complete her ride. Before standing in the queue for that ride, Bipasha took a 1-hour coffee break after completing her previous ride.

    651.

    What was the total amount spent on tickets (in Rs.) by Bipasha?

    Option B is the correct answer.

    Video Explanation

    Explanatory Answer

    Step 1:

    From condition (1) and (2), it can be concluded that Chitra did two rides - Ride 1 and Ride 3 at
    time 10 am to 11 am and 9 am to 10 am respectively since Anjali waited for 30 min to complete ride 1 which Anjali took at 11 am.

    From condition (3), it can be concluded that Bipasha paid for one ride till 12:15, i.e., Ride 2 only
    from 11:30 to 12:30 and since Bipasha took 3 rides in total she must not have taken ride 3 as it closes at 1 pm

    Screenshot_50.png     


    Step 2:

    From condition (4), it can be concluded that the schedule of Bipasha must be

    11:30 am to 12:30 pm (Ride 2)

    12:30 pm to 1:30 pm

    1:30 pm to 2:30 pm (Coffee Break)

    2:30 pm to 3 pm (waited)

    3 pm to 4 pm (Last Ride)

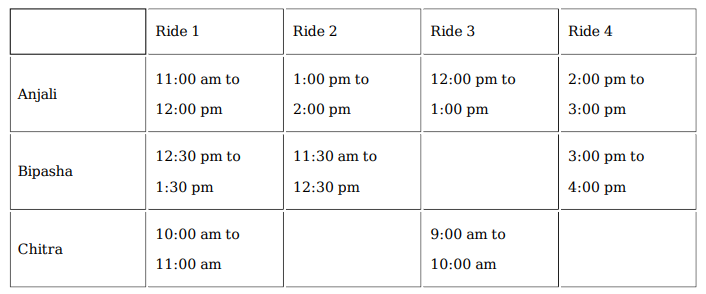
    Since Bipasha waited from 2:30 pm to 3:00 pm for Anjali to complete the last ride, therefore her last ride got completed at 3 pm.

    Final table looks like: 

    Screenshot_51.png     

    652.

    Which were all the rides that Anjali completed by 2:00 pm?

    Option B is the correct answer.

    Video Explanation

    Explanatory Answer

    Step 1:

    From condition (1) and (2), it can be concluded that Chitra did two rides - Ride 1 and Ride 3 at
    time 10 am to 11 am and 9 am to 10 am respectively since Anjali waited for 30 min to complete ride 1 which Anjali took at 11 am.

    From condition (3), it can be concluded that Bipasha paid for one ride till 12:15, i.e., Ride 2 only
    from 11:30 to 12:30 and since Bipasha took 3 rides in total she must not have taken ride 3 as it closes at 1 pm

    Screenshot_50.png     


    Step 2:

    From condition (4), it can be concluded that the schedule of Bipasha must be

    11:30 am to 12:30 pm (Ride 2)

    12:30 pm to 1:30 pm

    1:30 pm to 2:30 pm (Coffee Break)

    2:30 pm to 3 pm (waited)

    3 pm to 4 pm (Last Ride)

    Since Bipasha waited from 2:30 pm to 3:00 pm for Anjali to complete the last ride, therefore her last ride got completed at 3 pm.

    Final table looks like: 

    Screenshot_51.png     

    653.

    Which ride was taken by all three visitors?

    Option B is the correct answer.

    Video Explanation

    Explanatory Answer

    Step 1:

    From condition (1) and (2), it can be concluded that Chitra did two rides - Ride 1 and Ride 3 at
    time 10 am to 11 am and 9 am to 10 am respectively since Anjali waited for 30 min to complete ride 1 which Anjali took at 11 am.

    From condition (3), it can be concluded that Bipasha paid for one ride till 12:15, i.e., Ride 2 only
    from 11:30 to 12:30 and since Bipasha took 3 rides in total she must not have taken ride 3 as it closes at 1 pm

    Screenshot_50.png     


    Step 2:

    From condition (4), it can be concluded that the schedule of Bipasha must be

    11:30 am to 12:30 pm (Ride 2)

    12:30 pm to 1:30 pm

    1:30 pm to 2:30 pm (Coffee Break)

    2:30 pm to 3 pm (waited)

    3 pm to 4 pm (Last Ride)

    Since Bipasha waited from 2:30 pm to 3:00 pm for Anjali to complete the last ride, therefore her last ride got completed at 3 pm.

    Final table looks like: 

    Screenshot_51.png     

    654.

    How many rides did Anjali and Chitra take in total?

    Answer : 6

    Video Explanation

    Explanatory Answer

    Step 1:

    From condition (1) and (2), it can be concluded that Chitra did two rides - Ride 1 and Ride 3 at
    time 10 am to 11 am and 9 am to 10 am respectively since Anjali waited for 30 min to complete ride 1 which Anjali took at 11 am.

    From condition (3), it can be concluded that Bipasha paid for one ride till 12:15, i.e., Ride 2 only
    from 11:30 to 12:30 and since Bipasha took 3 rides in total she must not have taken ride 3 as it closes at 1 pm

    Screenshot_50.png     


    Step 2:

    From condition (4), it can be concluded that the schedule of Bipasha must be

    11:30 am to 12:30 pm (Ride 2)

    12:30 pm to 1:30 pm

    1:30 pm to 2:30 pm (Coffee Break)

    2:30 pm to 3 pm (waited)

    3 pm to 4 pm (Last Ride)

    Since Bipasha waited from 2:30 pm to 3:00 pm for Anjali to complete the last ride, therefore her last ride got completed at 3 pm.

    Final table looks like: 

    Screenshot_51.png     

    655.

    What was the total amount spent on tickets (in Rs.) by Anjali?

    Answer : 140

    Video Explanation

    Explanatory Answer

    Step 1:

    From condition (1) and (2), it can be concluded that Chitra did two rides - Ride 1 and Ride 3 at
    time 10 am to 11 am and 9 am to 10 am respectively since Anjali waited for 30 min to complete ride 1 which Anjali took at 11 am.

    From condition (3), it can be concluded that Bipasha paid for one ride till 12:15, i.e., Ride 2 only
    from 11:30 to 12:30 and since Bipasha took 3 rides in total she must not have taken ride 3 as it closes at 1 pm

    Screenshot_50.png     


    Step 2:

    From condition (4), it can be concluded that the schedule of Bipasha must be

    11:30 am to 12:30 pm (Ride 2)

    12:30 pm to 1:30 pm

    1:30 pm to 2:30 pm (Coffee Break)

    2:30 pm to 3 pm (waited)

    3 pm to 4 pm (Last Ride)

    Since Bipasha waited from 2:30 pm to 3:00 pm for Anjali to complete the last ride, therefore her last ride got completed at 3 pm.

    Final table looks like: 

    Screenshot_51.png     

    693.

    What was the total amount spent on tickets (in Rs.) by Bipasha?

    Option B is the correct answer.

    Video Explanation

    Explanatory Answer

    Step 1:

    From condition (1) and (2), it can be concluded that Chitra did two rides - Ride 1 and Ride 3 at
    time 10 am to 11 am and 9 am to 10 am respectively since Anjali waited for 30 min to complete ride 1 which Anjali took at 11 am.

    From condition (3), it can be concluded that Bipasha paid for one ride till 12:15, i.e., Ride 2 only
    from 11:30 to 12:30 and since Bipasha took 3 rides in total she must not have taken ride 3 as it closes at 1 pm

    Screenshot_50.png     


    Step 2:

    From condition (4), it can be concluded that the schedule of Bipasha must be

    11:30 am to 12:30 pm (Ride 2)

    12:30 pm to 1:30 pm

    1:30 pm to 2:30 pm (Coffee Break)

    2:30 pm to 3 pm (waited)

    3 pm to 4 pm (Last Ride)

    Since Bipasha waited from 2:30 pm to 3:00 pm for Anjali to complete the last ride, therefore her last ride got completed at 3 pm.

    Final table looks like: 

    Screenshot_51.png     

    694.

    Which were all the rides that Anjali completed by 2:00 pm?

    Option B is the correct answer.

    Video Explanation

    Explanatory Answer

    Step 1:

    From condition (1) and (2), it can be concluded that Chitra did two rides - Ride 1 and Ride 3 at
    time 10 am to 11 am and 9 am to 10 am respectively since Anjali waited for 30 min to complete ride 1 which Anjali took at 11 am.

    From condition (3), it can be concluded that Bipasha paid for one ride till 12:15, i.e., Ride 2 only
    from 11:30 to 12:30 and since Bipasha took 3 rides in total she must not have taken ride 3 as it closes at 1 pm

    Screenshot_50.png     


    Step 2:

    From condition (4), it can be concluded that the schedule of Bipasha must be

    11:30 am to 12:30 pm (Ride 2)

    12:30 pm to 1:30 pm

    1:30 pm to 2:30 pm (Coffee Break)

    2:30 pm to 3 pm (waited)

    3 pm to 4 pm (Last Ride)

    Since Bipasha waited from 2:30 pm to 3:00 pm for Anjali to complete the last ride, therefore her last ride got completed at 3 pm.

    Final table looks like: 

    Screenshot_51.png     

    695.

    Which ride was taken by all three visitors?

    Option B is the correct answer.

    Video Explanation

    Explanatory Answer

    Step 1:

    From condition (1) and (2), it can be concluded that Chitra did two rides - Ride 1 and Ride 3 at
    time 10 am to 11 am and 9 am to 10 am respectively since Anjali waited for 30 min to complete ride 1 which Anjali took at 11 am.

    From condition (3), it can be concluded that Bipasha paid for one ride till 12:15, i.e., Ride 2 only
    from 11:30 to 12:30 and since Bipasha took 3 rides in total she must not have taken ride 3 as it closes at 1 pm

    Screenshot_50.png     


    Step 2:

    From condition (4), it can be concluded that the schedule of Bipasha must be

    11:30 am to 12:30 pm (Ride 2)

    12:30 pm to 1:30 pm

    1:30 pm to 2:30 pm (Coffee Break)

    2:30 pm to 3 pm (waited)

    3 pm to 4 pm (Last Ride)

    Since Bipasha waited from 2:30 pm to 3:00 pm for Anjali to complete the last ride, therefore her last ride got completed at 3 pm.

    Final table looks like: 

    Screenshot_51.png     

    696.

    How many rides did Anjali and Chitra take in total?

    Answer : 6

    Video Explanation

    Explanatory Answer

    Step 1:

    From condition (1) and (2), it can be concluded that Chitra did two rides - Ride 1 and Ride 3 at
    time 10 am to 11 am and 9 am to 10 am respectively since Anjali waited for 30 min to complete ride 1 which Anjali took at 11 am.

    From condition (3), it can be concluded that Bipasha paid for one ride till 12:15, i.e., Ride 2 only
    from 11:30 to 12:30 and since Bipasha took 3 rides in total she must not have taken ride 3 as it closes at 1 pm

    Screenshot_50.png     


    Step 2:

    From condition (4), it can be concluded that the schedule of Bipasha must be

    11:30 am to 12:30 pm (Ride 2)

    12:30 pm to 1:30 pm

    1:30 pm to 2:30 pm (Coffee Break)

    2:30 pm to 3 pm (waited)

    3 pm to 4 pm (Last Ride)

    Since Bipasha waited from 2:30 pm to 3:00 pm for Anjali to complete the last ride, therefore her last ride got completed at 3 pm.

    Final table looks like: 

    Screenshot_51.png     

    697.

    What was the total amount spent on tickets (in Rs.) by Anjali?

    Answer : 140

    Video Explanation

    Explanatory Answer

    Step 1:

    From condition (1) and (2), it can be concluded that Chitra did two rides - Ride 1 and Ride 3 at
    time 10 am to 11 am and 9 am to 10 am respectively since Anjali waited for 30 min to complete ride 1 which Anjali took at 11 am.

    From condition (3), it can be concluded that Bipasha paid for one ride till 12:15, i.e., Ride 2 only
    from 11:30 to 12:30 and since Bipasha took 3 rides in total she must not have taken ride 3 as it closes at 1 pm

    Screenshot_50.png     


    Step 2:

    From condition (4), it can be concluded that the schedule of Bipasha must be

    11:30 am to 12:30 pm (Ride 2)

    12:30 pm to 1:30 pm

    1:30 pm to 2:30 pm (Coffee Break)

    2:30 pm to 3 pm (waited)

    3 pm to 4 pm (Last Ride)

    Since Bipasha waited from 2:30 pm to 3:00 pm for Anjali to complete the last ride, therefore her last ride got completed at 3 pm.

    Final table looks like: 

    Screenshot_51.png     

    698.

    The lengths of all four sides of a quadrilateral are integer valued. If three of its sides are of length 1 cm, 2 cm and 4 cm, then the total number of possible lengths of the fourth side is


    Option C is the correct answer.

    Video Explanation

    Explanatory Answer

    In any polygon, the largest side length should be less than the sum of the lengths of the other sides.
    Let the fourth side be ‘x’.
    Case i) x is the largest side.
    x < 1 + 2 + 6
    x < 7
    x can take the following values, 4, 5, 6
    Case ii)
    4 is the largest side and x is less than 4.
    4 < x + 1 +2
    x > 1
    x can take the values 2 or 3
    So, x can take the values 2, 3, 4, 5, 6.
    x can take 5 values.

    700.

    A donation box can receive only cheques of ₹100, ₹250, and ₹500. On one good day, the donation box was found to contain exactly 100 cheques amounting to a total sum of ₹15250. Then, the maximum possible number of cheques of ₹500 that the donation box may have contained, is

     
    Answer : The answer is '12'

    Video Explanation

    Explanatory Answer

    Since the total donation amount is 15,250 rupees, there should be at least one 250 rupee note. The remaining 15000 can exist as thirty 500 rupee notes.

    Since the total donation amount is 15,250 rupees, there should be at least one 250 rupee note. The remaining 15000 can exist as thirty 500 rupee notes.

    Rs. 250 Rs. 500 Rs. 100 Number of notes
    1 30 0 31

    But the total number of notes will only be 31. We have 100 notes. So to keep the number of 500 notes as high as possible let’s convert the 500 rupee notes to 100 rupee notes. Every time we do this conversion we add 4 new notes.

    Rs. 250 Rs. 500 Rs. 100 Number of notes
    1 30 0 31
    1 29 5 35
    We add 4 new notes in each conversion, Our target is to reach 100 notes from 35 notes, the closest we can got to 100 by adding only 4’s to 35 is 99
    99 = 35 + 4 (16)
    So this happens after 16 steps
    1 13 85 99

    From here, we can convert one 500 rupee note to two 250 rupee notes.

    3 12 85 100

    So, the maximum number of 500 rupee notes is 12